Alfresco CE direct monitoring for Nagios via curl command
JMX information is available from Alfresco Enterprise 3.2, giving
many possibilities to external monitoring tools like Nagios/Icinga for
checking Alfresco variables. An example is the well-known
Nagios/Icinga plugin for monitoring Alfresco.
- https://github.com/toniblyx/alfresco-nagios-and-icinga-plugin
The most interesting information of this plugin is for Enterprise
Edition (EE), although general monitoring commands (not JMX-based) may
be used for Community Edition (CE) too. For example, in an Alfresco CE
installation we use some Nagios plugins like:
- check_http for direct monitorization of http(s)
service (like 80 or 443) - check_tcp for checking Tomcat and Alfresco ports
(like 8009, 8080, 8443 or 50500) - check_snmp for checking CPU, RAM, Load & Swap
(via standard SNMP protocol) - check_esxi for checking similar metrics from VMware
API point of view (if your instance is virtualized) - check_tomcat for monitoring threads and JVM
- check_mysql for monitoring your database pool connections
Last
day, we tested Alfresco OOTB Support Tools addon for Community
Edition, and this addon provides some of this useful information
about JVM, threads or logged users, that can be consumed from Alfresco
OOTB webscripts via curl command, for generating alerts and graphs. We
can use the JSON information of the webscripts (thanks Axel Faust, for
showing me this), in some shell scripts like this:
check_ootb_active_sessions.sh
#!/bin/bash
#
#  Author: Cesar Capillas
#
#  https://github.com/CesarCapillas
#

SERVER=$1
PORT=$2
USERNAME=$3
PASSWORD=$4
VAR=$5
WARNING=${6:-100}
CRITICAL=${7:-200}

if [ "$PORT" = "443" ]; then
   PROTOCOL="https"
else
   PROTOCOL="http"
fi

# Endpoint for Alfresco CE with OOTB Support Tools
ENDPOINT="$PROTOCOL://${SERVER}:${PORT}/alfresco/service/ootbee/admin/active-sessions?format=json"
# Endpoint for Alfresco EE with Support Tools addon
#ENDPOINT="$PROTOCOL://${SERVER}:${PORT}/alfresco/service/enterprise/admin/admin-activesessions?format=json"

if [[ "$1" == "" ]]; then
  echo "USAGE:"
  echo "  check_ootb_active_sessions.sh <SERVER> <PORT> <USERNAME> <PASSWORD> <VAR> <WARNING> <CRITICAL>"
  echo
  echo "    where VAR=[NumActive|MaxActive|NumIdle|UserCountNonExpired|TicketCountNonExpired]"
  echo
  exit
fi

CURL=`curl --silent -u ${USERNAME}:${PASSWORD} -X GET ${ENDPOINT}`
CHCK=`echo $CURL | grep "$5"`

if [[ "$CHCK" == "" ]]; then
   CHECK="Failed"
else
   CHECK="OK"
   ACTIVE_SESSION_VAR=`echo $CURL | jshon -e $5 | sed 's/"//g'`
fi

if [[ "$CHECK" == "OK" ]]; then
   if (($ACTIVE_SESSION_VAR > $CRITICAL));then
      echo "CRITICAL: $5 = $ACTIVE_SESSION_VAR (>$CRITICAL)"
      exit 2
   fi
   if (($ACTIVE_SESSION_VAR > $WARNING));then
      echo "WARNING: $5 = $ACTIVE_SESSION_VAR (>$WARNING)"
      exit 1
   fi

   echo "INFO: Sessions ($5) = $ACTIVE_SESSION_VAR"
   exit 0
elif [[ "$CHECK" == "Failed" ]]; then
   echo "CRITICAL: ${SERVER}"
   exit 2
else
   echo "Check failed."
   exit 3
fi
check_ootb_performance_stats.sh
#!/bin/bash
#
#  Author: Cesar Capillas
#
#  https://github.com/CesarCapillas
#
#  License: see accompanying LICENSE file
#

SERVER=$1
PORT=$2
USERNAME=$3
PASSWORD=$4
VAR=$5
WARNING=${6:-10000}
CRITICAL=${7:-10000}
if [ "$PORT" = "443" ]; then
   PROTOCOL="https"
else
   PROTOCOL="http"
fi

# Endpoint for Alfresco CE with OOTB Support Tools
ENDPOINT="$PROTOCOL://${SERVER}:${PORT}/alfresco/service/ootbee/admin/admin-performance?format=json"
# Endpoint for Alfresco EE with Support Tools addon
#ENDPOINT="$PROTOCOL://${SERVER}:${PORT}/alfresco/service/enterprise/admin/admin-performance?format=json"

# Most useful are UsedMemory (JVM) and ThreadCount
#   Memory is in Mb Ej; 4096M
#   Load is in percentage

if [[ "$1" == "" ]]; then
  echo "USAGE:"
  echo "  check_ootb_performance_stats.sh <SERVER> <PORT> <USERNAME> <PASSWORD> <VAR> <WARNING> <CRITICAL>"
  echo
  echo "    where VAR=[MaxMemory|TotalMemory|UsedMemory|FreeMemory|ProcessLoad|SystemLoad|ThreadCount|PeakThreadCount]"
  echo
  echo $CURL
  exit
fi

CURL=`curl --silent -u ${USERNAME}:${PASSWORD} -X GET ${ENDPOINT}`
CHCK=`echo $CURL | grep "$5"`

if [[ "$CHCK" == "" ]]; then
   CHECK="Failed"
else
   CHECK="OK"
   PERFORMANCE_VAR=`echo $CURL | jshon -e $5`
fi

if [[ "$CHECK" == "OK" ]]; then
   if (($PERFORMANCE_VAR > $CRITICAL));then
      echo "CRITICAL: $5 = $PERFORMANCE_VAR (>$CRITICAL)"
      exit 2
   fi
   if (($PERFORMANCE_VAR > $WARNING));then
      echo "WARNING: $5 = $PERFORMANCE_VAR (>$WARNING)"
      exit 1
   fi

   echo "INFO: $5 = $PERFORMANCE_VAR"
   exit 0

elif [[ "$CHECK" == "Failed" ]]; then
   echo "CRITICAL: ${SERVER}"
   exit 2
else
   echo "Check failed."
   exit 3
fi
The two upper scripts use curl and jshon
commands. The corresponding commands for Nagios look like:
ootb-commands.cfg
define command {
        command_name    check_performance_stats
        command_line    /usr/lib/nagios/plugins/check_ootb_performance_stats.sh '$ARG1$' '$ARG2$' '$ARG3$' '$ARG4$' '$ARG5$' '$ARG6$' '$ARG7$'
}

define command {
        command_name    check_active_sessions
        command_line    /usr/lib/nagios/plugins/check_ootb_active_sessions.sh '$ARG1$' '$ARG2$' '$ARG3$' '$ARG4$' '$ARG5$' '$ARG6$' '$ARG7$'
}
And finally we define services for an Alfresco host (alf5) in the
next file:
services_ootb.cfg
define service {
        use                             generic-service
        host_name                       alf5
        service_description             [OOTB] Number of active database connections
        max_check_attempts              3
        normal_check_interval           10
        retry_check_interval            3
        check_command                   check_active_sessions!alfie.zylk.net!443!monitor!secret!NumActive!15!20
}

define service {
        use                             generic-service
        host_name                       alf5
        service_description             [OOTB] Number of logged users
        max_check_attempts              3
        normal_check_interval           10
        retry_check_interval            3
        check_command                   check_active_sessions!alfie.zylk.net!443!monitor!secret!UserCountNonExpired!15!20
}

define service {
        use                             generic-service
        host_name                       alf5
        service_description             [OOTB] Number of tickets
        max_check_attempts              3
        normal_check_interval           10
        retry_check_interval            3
        check_command                   check_active_sessions!alfie.zylk.net!443!monitor!secret!TicketCountNonExpired!15!20
}

define service {
        use                             generic-service
        host_name                       alf5
        service_description             [OOTB] JVM Used Memory
        max_check_attempts              3
        normal_check_interval           10
        retry_check_interval            3
        check_command                   check_performance_stats!alfie.zylk.net!443!monitor!secret!UsedMemory!3500!4000
}

define service {
        use                             generic-service
        host_name                       alf5
        service_description             [OOTB] Number of Threads
        max_check_attempts              3
        normal_check_interval           10
        retry_check_interval            3
        check_command                   check_performance_stats!alfie.zylk.net!443!monitor!secret!ThreadCount!225!250
}

define service {
        use                             generic-service
        host_name                       alf5
        service_description             [OOTB] Process Load
        max_check_attempts              3
        normal_check_interval           10
        retry_check_interval            3
        check_command                   check_performance_stats!alfie.zylk.net!443!monitor!secret!ProcessLoad!75!85
}

define service {
        use                             generic-service
        host_name                       alf5
        service_description             [OOTB] System Load
        max_check_attempts              3
        normal_check_interval           10
        retry_check_interval            3
        check_command                   check_performance_stats!alfie.zylk.net!443!monitor!secret!SystemLoad!85!95
}
Similar webscripts are found for the original support tools work
of Antonio Soler, so it is quite simple to change the
corresponding webscript endpoints in the shell scripts. Other safer
possibility may be, instead of a direct monitoring, to run this
script locally from Alfresco Server, and to expose those metrics via
NRPE or SNMP custom comands.
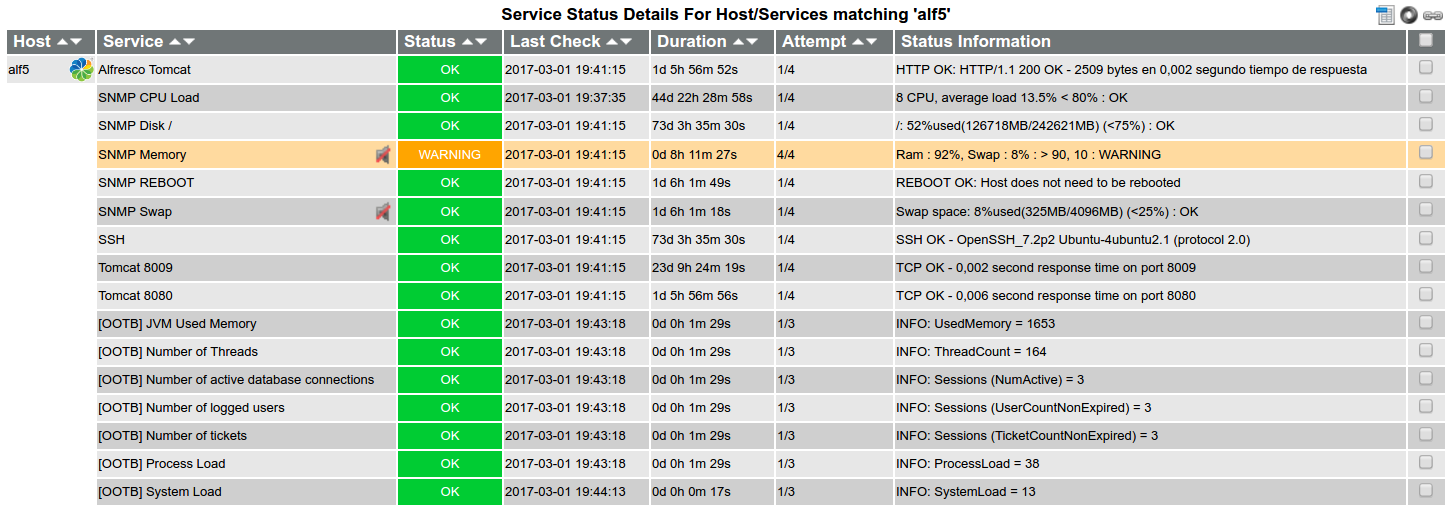
And the result for this:

Links:
- https://www.zylk.net/actualidad/ootb-support-tools-addon-for-alfresco-community/
- https://www.zylk.net/actualidad/la-consola-de-admin-de-alfresco-ee-y-el-modulo-de-support-tools/
- https://github.com/toniblyx/alfresco-nagios-and-icinga-plugin
- https://github.com/OrderOfTheBee/ootbee-support-tools
- https://github.com/Alfresco/alfresco-support-tools


