Direct monitoring with Elastic Stack 7
Last days I was exploring several features of Elastic Stack in version 7.2, including some of the available Beats agents. In this case, I played a beat with Heartbeat agent, that it is able to perform direct monitoring via TCP / HTTP / ICMP for a given url / host of a given service. It is a basic direct monitoring where we can ping everything, and then indexing this monitoring data in Elastic Search.
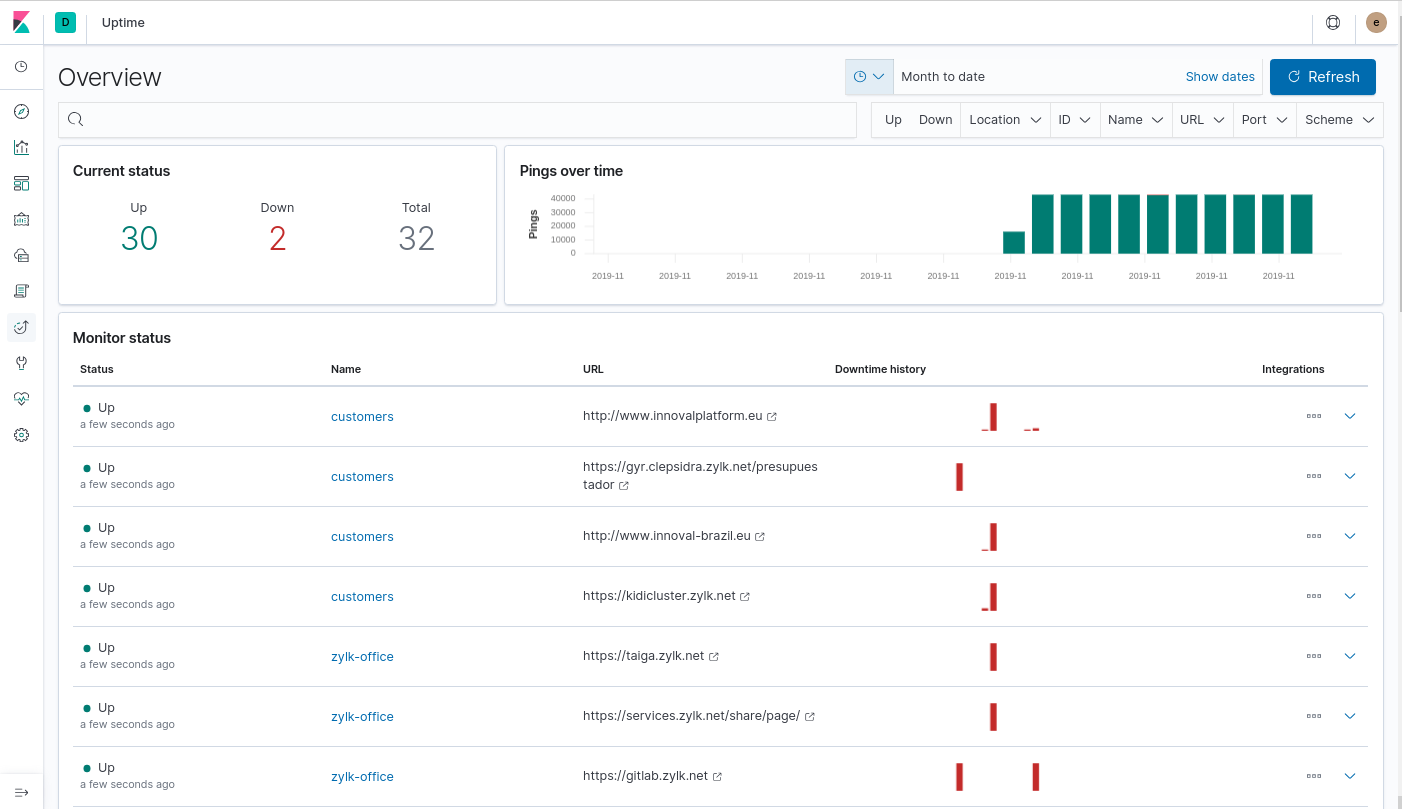
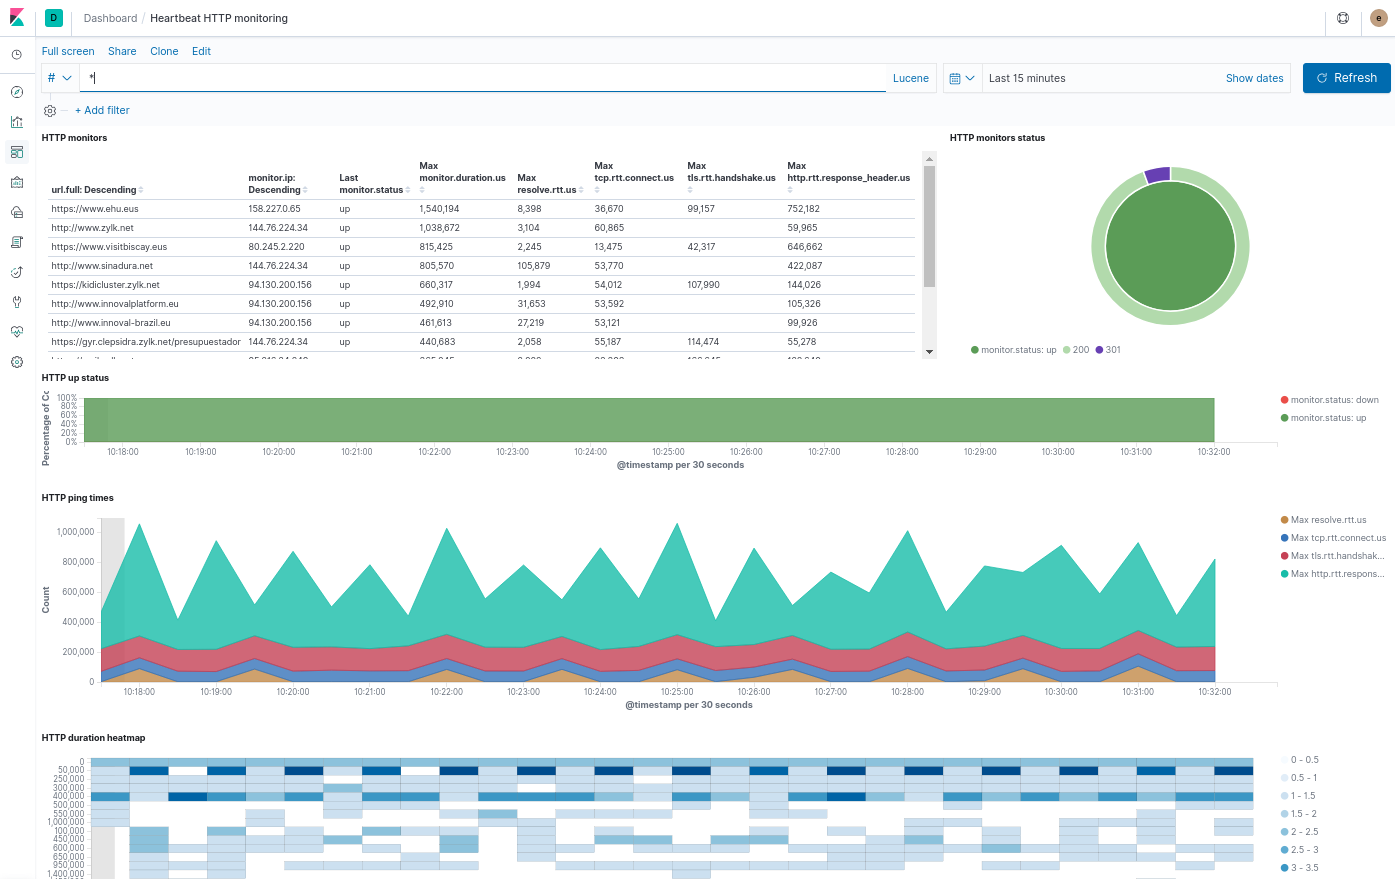
In Kibana, we can find an Uptime section for visualization. It is also available a (useful) custom dashboard from 6.x version too, which can be found in github repo and imported in Kibana.
Monitors configurations may be added on the fly with a minimal setup. The obtained events are usually processed with logstash plugins for alerting via email or slack, normally out of the basic license.
In Uptime section, we can find an overview of all the pings done:

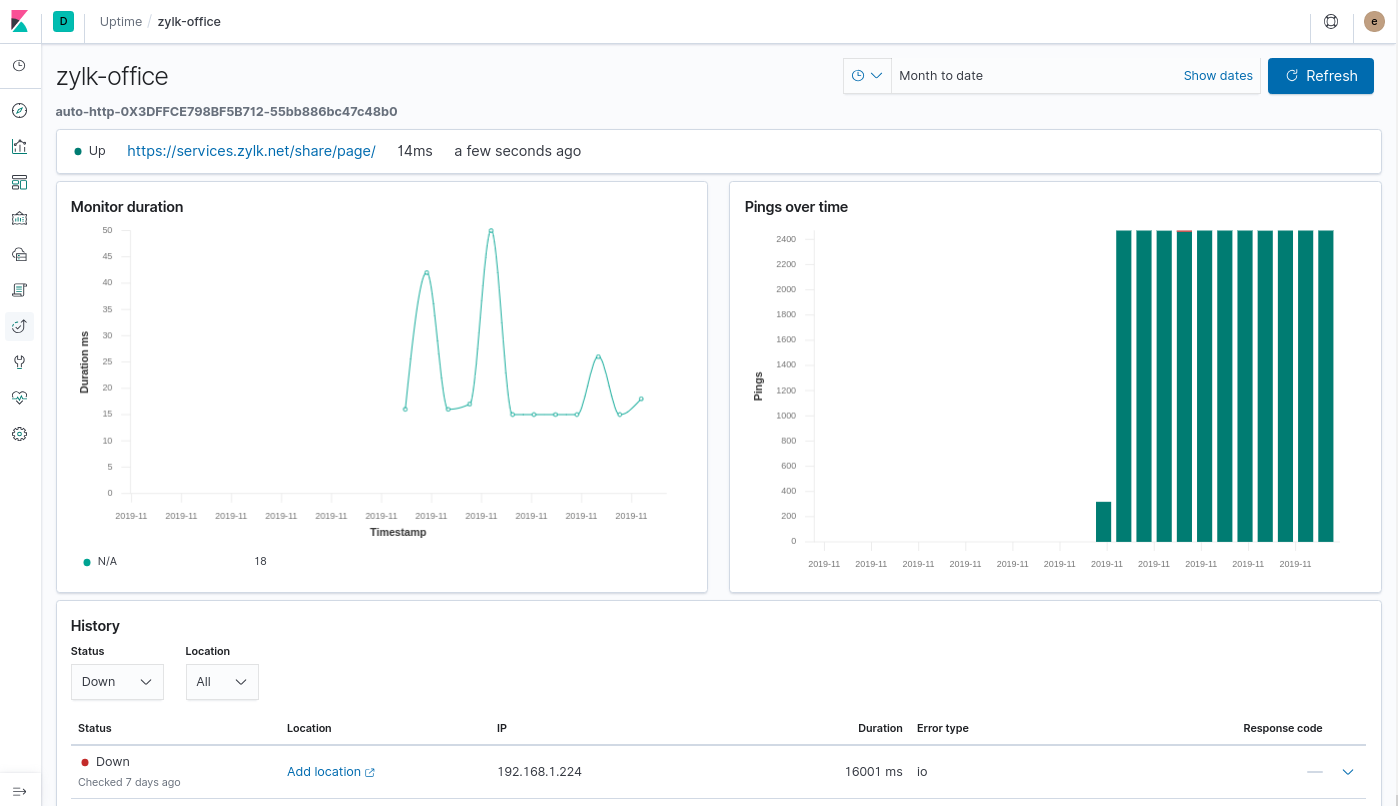
with a dedicated page overview for a given url:

Finally, this is the aspect of the imported dashboard:

External links:
- https://www.elastic.co/es/products/beats/heartbeat
- https://www.elastic.co/guide/en/beats/heartbeat/current/configuring-howto-heartbeat.html
- https://github.com/elastic/uptime-contrib/tree/master/dashboard
«One night of magic rush, the start a simple touch ,,, ten days of perfect tunes, the colors red and blue» (Heartbeats – Jose Gonzalez)

.jpg)


