Monitoring Alfresco access logs
In last Alfresco Devcon, I presented some basic configuration for Alfresco monitoring with Elastic stack (ELK). A very nice automated setup for testing this configuration in ELK 6.1 is via the docker compose setup given in this github project:
$ git clone https://github.com/deviantony/docker-elk
$ cd docker-elk
This is an opportunity of checking Elastic Stack new features in 6.1 version, for example the new Kibana homepage, some UI accesibility new features, the dashboard full screen mode, pie data chart labels, dashboard input controls, or new kuery search syntax. Take in consideration that previous Alfresco configuration was done with ELK version 5.2, some extra Logstash plugin were needed (jmx), and Kibana exports may not work in 6.x version. But mostly Logstash config (logstash.conf) is reusable.
For today we are going to show a slighlty different example with Alfresco Tomcat Access Logs.
In the docker compose file of the project, you can edit JVM settings and used ports (usually 9200 for ES, 5601 for KI and 5000 for tcp input in logstash – I added 5001 for an addition tcp input)
$ vim docker-compose.yml

ES_JAVA_OPTS: "-Xmx1024m -Xms1024m"
LS_JAVA_OPTS: "-Xmx1024m -Xms1024m"
Added port "5001:5001" for tcp input for logstash
Then you also can customize your logstash configuration according your use case:
# Tune Logstash config in
$ logstash/pipeline/logstash.conf
And then just docker compose up:
# Docker compose
$ docker-compose up
The logstash config is something like this:
##
## Tomcat logs inputs
##
input {
  tcp {
    type => "alfresco-log"
    port => 5000
  }

#  file {
#    path => ["/opt/alfresco522/tomcat/logs/catalina.out", "/opt/alfresco522/tomcat/logs/catalina*out*"]
#  }


  tcp {
    type => "access-log"
    port => 5001
  }

#  file {
#    path => ["/opt/alfresco522/tomcat/logs/localhost*access*"]
#  }

}

##
## Filters for Alfresco logs (catalina.out)
##
filter {
  if [type] == "alfresco-log" {
    # replace double blank space with single blank space
    mutate {
      gsub => [
        "message", "  ", " "
      ]
    }

    # Match incoming log entries to fields logLevel, class and Msg
    grok {
      match => [ "message", "%{TIMESTAMP_ISO8601:logdate}s*%{LOGLEVEL:logLevel} %{NOTSPACE:class}s*%{GREEDYDATA:Msg}" ]
    }

    # Match logdate from timestamp
    date {
       match => ["logdate" , "yyyy-MM-dd HH:mm:ss,SSS"]
       target => "@timestamp"
    }
  }
}

##
## Filters for Tomcat access logs
##
filter {
  if [type] == "access-log" {
    grok {
      #match => [ "message", "%{IPORHOST:clientip} %{USER:ident} %{DATA:auth} [%{HTTPDATE:timestamp}] "(%{WORD:verb} %{NOTSPACE:request} (HTTP/%{NUMBER:httpversion})?|%{DATA:rawrequest})" %{NUMBER:response} (?:%{NUMBER:bytes}|-) %{QS:referrer} %{QS:agent} %{NUMBER:responseTime} "%{DATA:thread}"" ]
      match => [ "message", "%{IPORHOST:clientip} %{USER:ident} %{DATA:auth} [%{HTTPDATE:timestamp}] "(%{WORD:verb} %{NOTSPACE:request} (HTTP/%{NUMBER:httpversion})?|%{DATA:rawrequest})" %{NUMBER:response} (?:%{NUMBER:bytes}|-)" ]
    }

    #mutate {
    #  convert => [ "responseTime", "float" ]
    #}

    date {
      match => [ "timestamp" , "dd/MMM/YYYY:HH:mm:ss Z" ]
      target => "@timestamp"
    }
  }
}

##
## Output to Elasticsearch
##
output {
  #Uncomment for debugging purposes
  #stdout { codec => rubydebug }

  if [type] == "access-log" {
    elasticsearch {
      index => "logstash-tomcat-%{+YYYY.MM.dd}"
      hosts => "elasticsearch:9200"
    }
  }

  if [type] == "alfresco-log" {
    elasticsearch {
      index => "logstash-alfresco-%{+YYYY.MM.dd}"
      hosts => "elasticsearch:9200"
    }
  }

#  if [type] == "alfresco-jmx" {
#    elasticsearch {
#      index => "logstash-jmx-%{+YYYY.MM.dd}"
#      hosts => "elasticsearch:9200"
#    }
#  }

#  if [type] == "alfresco-ootb" {
#    elasticsearch {
#      index => "logstash-ootb-%{+YYYY.MM.dd}"
#      hosts => "elasticsearch:9200"
#    }
#  }

}
In the example, we have configured 5000 and 5001 TCP ports for input data, which is a reusable way to input and analize log data of a customer, if you have previously prepared (or not) visualizations for this type logging data. So easily we can compose up the environment and input log data via netcat tool (which is part of nmap package in Linux if you miss it):
$ cd /opt/alfresco522/tomcat/logs
$ for i in `ls -1 localhost_access_log*`; do nc localhost 5001 < $i; sleep 3; done
When Kibana launches for the first time, it is not configured with any index pattern. So you need to create some index pattern in Kibana via Web UI (in this case, you need some data loaded previously), or just via curl with the following script:
#!/bin/bash
curl -XPOST -D- 'http://localhost:5601/api/saved_objects/index-pattern'
    -H 'Content-Type: application/json'
    -H 'kbn-version: 6.1.0'
    -d '{"attributes":{"title":"logstash-tomcat-*","timeFieldName":"@timestamp"}}'

curl -XPOST -D- 'http://localhost:5601/api/saved_objects/index-pattern'
    -H 'Content-Type: application/json'
    -H 'kbn-version: 6.1.0'
    -d '{"attributes":{"title":"logstash-alfresco-*","timeFieldName":"@timestamp"}}'
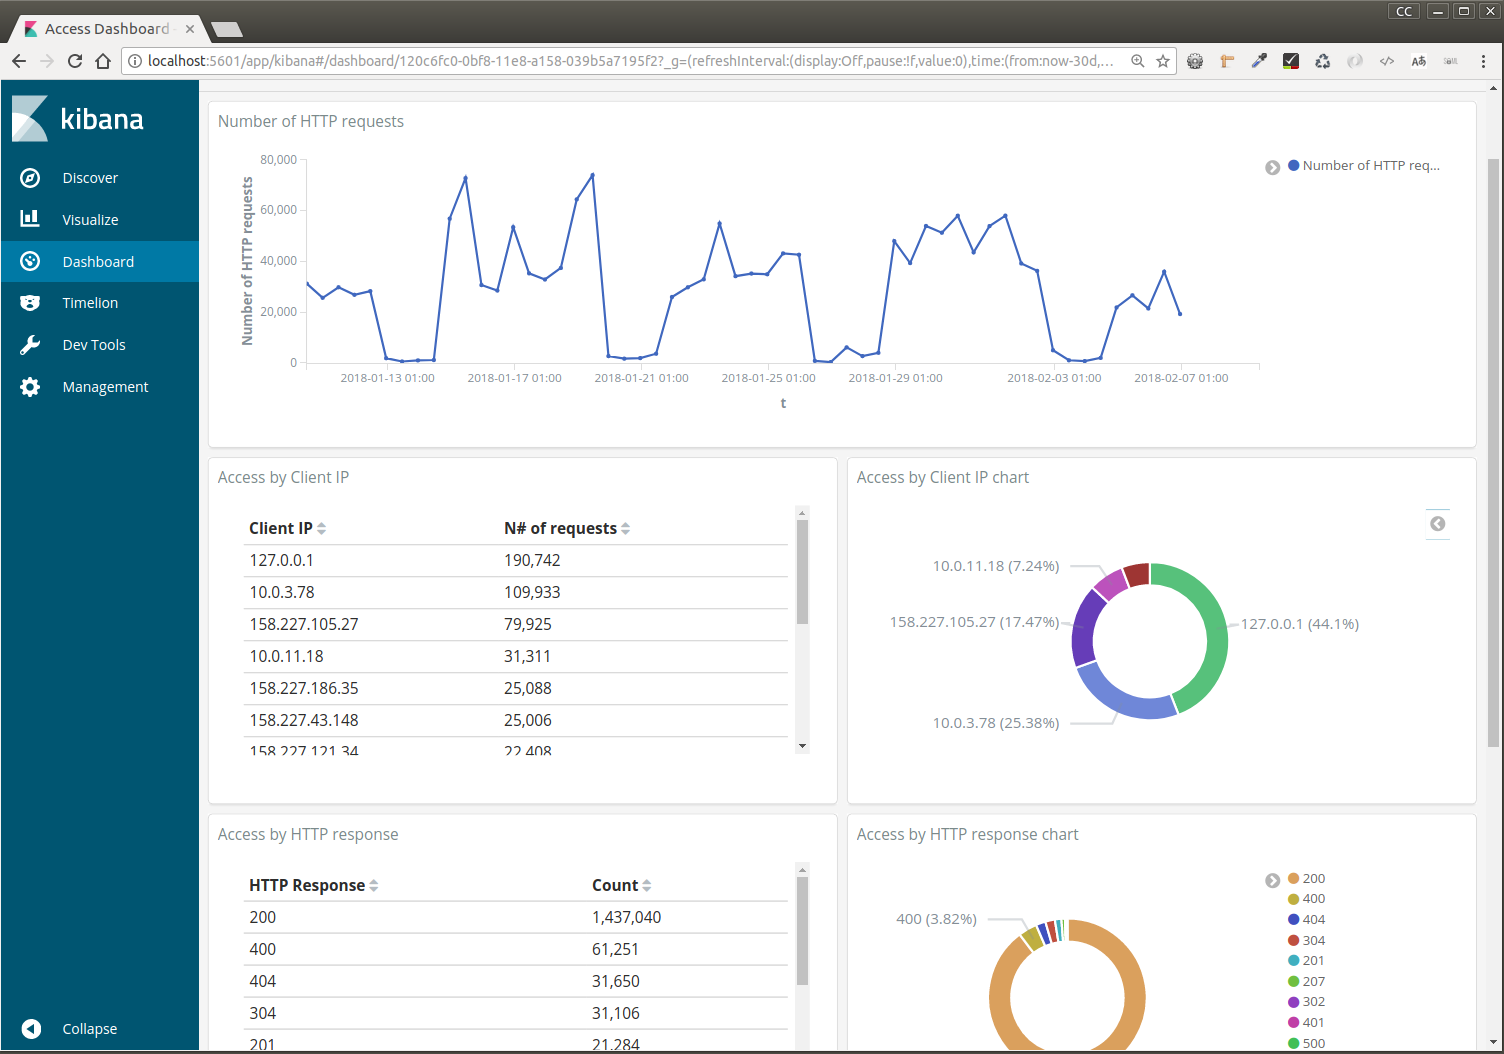
We created two different indices in this case (logstash-tomcat-*) and (logstash-alfresco-*) for different types of logs. And once the data is indexed, we have to configure the visualizations and dashboards in Kibana. And this is the final result.

The example is taken the default information of Tomcat valve’s configuration in server.xml. You can configure Tomcat’s valve to include referrer or response times in log data as here, which provides even richer information:
This help us, to analyze how much traffic in Alfresco is due a Share use case or CMIS API use case, the origin of the HTTP requests, the requests status or the corresponding response times.
Links:


