Monitoring Alfresco EE with ELK stack
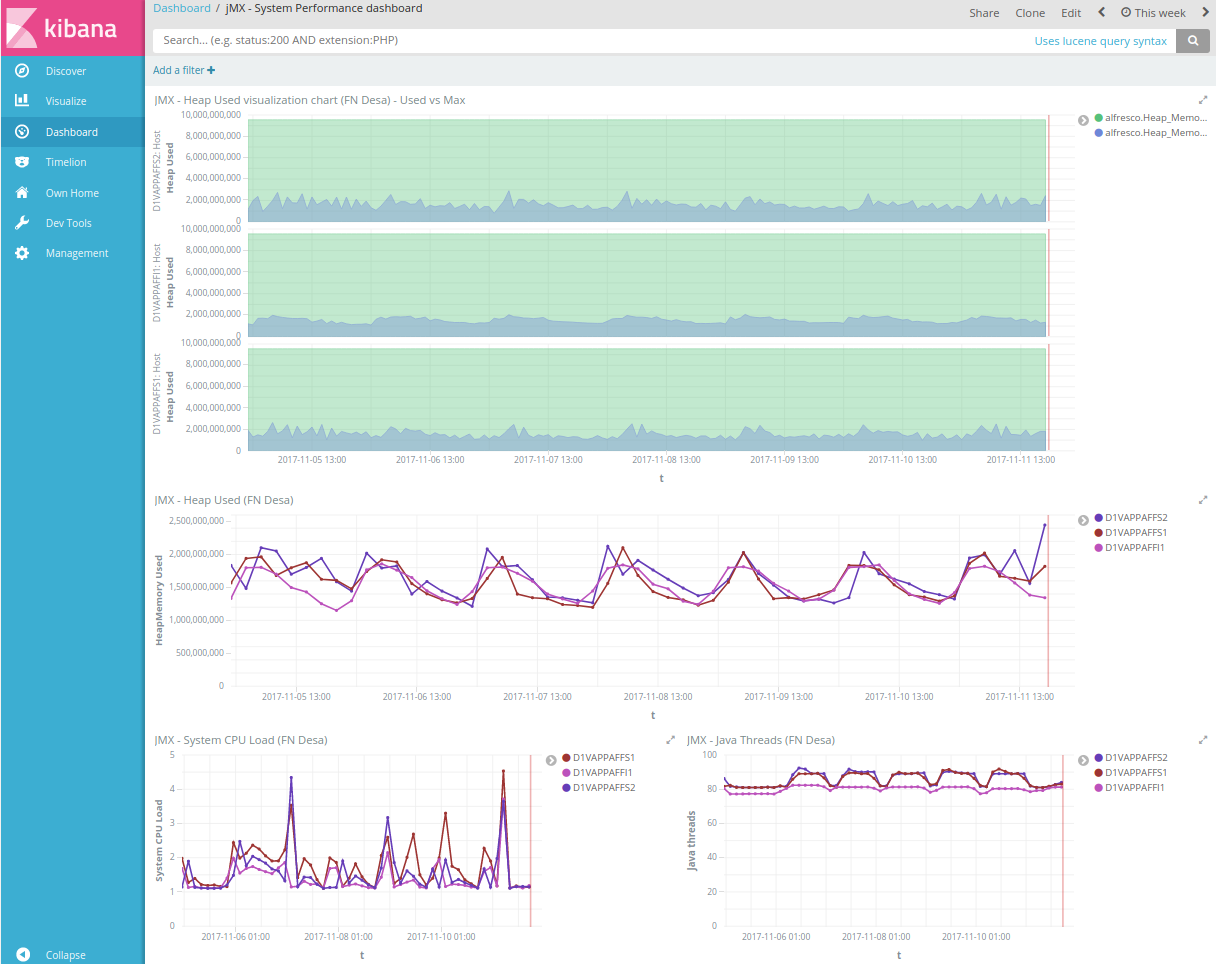
This weekend I read in Elastic blog that Mr. Robot uses Kibana for monitoring the Dark Army, so I decided to write a post about a recent monitoring project for representing some basic (but interesting) Alfresco JMX metrics in a clustered environment, in which I was involved last week. As you probably know, Kibana is a useful tool of the ELK stack, composed by Elastic Search as indexing backend, Logstash for data extraction, and the cited Kibana for graphic representation of the extracted metrics. The original idea was to have one or several Kibana dashboards for System performance and active sessions information, in the way of doing of Alfresco support tools, but providing a complete view of the cluster nodes, and also in a persisted way. In the past, this was done more or less with Nagios JMX module for Alfresco, enabling PNP graphs.
First, you need to enable JMX in Alfresco Enterprise 5.2 (aka Content Services). For details on enabling JMX in Alfresco check the following link:
In this proof of concept, we use JMX input in Logstash for getting Alfresco JMX objects. I used the 5.6.3 version of the stack, and it was needed to install jmx input plugin.
$ cd $LS_HOME
$ ./bin/logstash-plugin install logstash-input-jmx
The basic logstash config (logstash.conf) is the following:
##
## JMX (for Enterprise Edition)
##
##   JMX Config url and objects in $LS_HOME/jmx/jmx.conf
##

input {
  jmx{
    type => "jmx"
    path => "./jmx"
    polling_frequency => 30
  }
}

##
## Filters for JMX
##
filter {
  if [type] == "jmx" {
    if [metric_path] in [
    "alfresco.Operating_System.ProcessCpuLoad",
    "alfresco.Operating_System.SystemCpuLoad"
   ] {
     if [metric_value_number] {
       ruby {
         code => "event.set('metric_value_number',event.get('metric_value_number') * 100)"
        }
      }
    }

    # Convert string metric to numeric value
    if [metric_value_string] {
      mutate {
        convert => [ "metric_value_number", "float" ]
      }
    }
  }
}

##
## Output to Elasticsearch
##
output {
  #Uncomment for debugging purposes
  #stdout { codec => rubydebug }
  elasticsearch {
    hosts => ["localhost:9200"]
  }
}
In a previous blog post, we also worked with JMX objects for Nagios monitoring. This provides an alternative for monitoring focused in visualizations, instead of alerts and notifications. The JMX objects compiled in this proof of concept are the following. In $LS_HOME/jmx/jmx.conf
{
  "host" : "localhost",
  "port" : 50500,
  "url"  : "service:jmx:rmi:///jndi/rmi://localhost:50500/alfresco/jmxrmi",
  "username" : "monitorRole",
  "password": "change_asap",
  "alias": "alfresco",
  "queries" : [
    {
      "object_name" : "java.lang:type=Memory",
      "attributes" : [ "HeapMemoryUsage" ],
      "object_alias" : "Heap_Memory"
    },
    {
      "object_name" : "Alfresco:Name=SolrIndexes,Core=alfresco",
      "attributes" : [ "NumDocuments" ],
      "object_alias" : "Alfresco_Solr_Indexes"
    },
    {
      "object_name" : "Alfresco:Name=ConnectionPool",
      "attributes" : [ "MaxActive", "NumActive" ],
      "object_alias" : "DB_Connection_Pool"
    },
    {
      "object_name" : "Catalina:type=Manager,context=/alfresco,host=localhost",
      "attributes" : [ "activeSessions" ],
      "object_alias" : "Alfresco_Active_Sessions"
    },
    {
      "object_name" : "Alfresco:Name=RepoServerMgmt",
      "attributes" : [ "TicketCountNonExpired", "UserCountNonExpired" ],
      "object_alias" : "Repo_Server_Mgmt"
    },
    {
      "object_name" : "java.lang:type=OperatingSystem",
      "attributes" : [ "ProcessCpuLoad", "SystemCpuLoad", "SystemLoadAverage", "OpenFileDescriptorCount" ],
      "object_alias" : "Operating_System"
    },
    {
      "object_name" : "java.lang:type=Threading",
      "attributes" : [ "ThreadCount" ],
      "object_alias" : "Java_Threads"
    }
  ]
}
This basic sample of JMX objects will provide useful information of our system. Please note that, there exists different types of objects in the list, for example java.lang, Catalina and Alfresco ones. The Alfresco ones are only provided in Alfresco EE, while the others may be used even in Community Edition. A defined object like Heap_Memory may include different metrics (init, used, commited and max). You may browse and check the different JMX objects via a JMX console, for example jconsole o jmxterm.
Once logstash is running, you should have indices stored in Elastic Search each 30s (or with th e specified polling frequency), so you may see the obtained metrics in Kibana (searches). Consider too, where to place your logstash agent, it may be in each Alfresco node or in a dedicated node. As a result, we can do search over JMX indices from Kibana. In Kibana, you will see the JMX objects with the following fields:
- metric_path (string)
- metric_path_value: (number) – aggregatable
- host
It is essential to send JMX metrics as float numbers, because if Elastic uses metric_path_value as strings, you will be able to search in Kibana, but you could not create aggregates and no visualizations were possible. This is the reason for filtering data above and convert them in floats. Finally we can save some searches and visualizations to finally get the desired dashboards for your Alfresco environment.

Thanks to Irune Prado for introducing me to Kibana interface 😉
Finally Miguel Rodriguez (from Alfresco) has also very interesting stuff about ELK and Alfresco. I let some links related below.
P:S: «You’re only seeing what’s in front of you, you’re not seeing what’s above you.» #MrRobot
Links:
- https://docs.alfresco.com/5.0/tasks/jmx-access.html
- https://www.elastic.co/guide/en/logstash/current/plugins-inputs-jmx.html
- https://www.elastic.co/blog/monitoring-the-dark-army-with-kibana-mr-robot
- https://github.com/zylklab/alfresco-nagios
- https://github.com/toniblyx/alfresco-nagios-and-icinga-plugin
Additional Alfresco ELK resources:
- https://github.com/miguel-rodriguez/Docker-ELK-Alfresco-Monitoring
- https://community.alfresco.com/blogs/alfresco-premier-services/2017/06/20/alfresco-monitoring-with-docker-and-elk
- https://github.com/miguel-rodriguez/alfresco-monitoring


