Custom nagios shell script with curl command to monitor Ambari
Last day, we
tried some curl commands to check Ambari metrics of our Big Data
cluster. The next step for using these metrics collected in Ambari
Server is to include them in a Nagios / Icinga server for getting
email alerts and the usual monitoring stuff.
A simple example may be something like to obtain Ambari alerts
summary (Note: this can be improved a lot, it is just a probe of concept).
check_ambari_alerts_summary.sh
#!/bin/bash
SERVER=$1
PORT=$2
USERNAME=$3
PASSWORD=$4
CLUSTERNAME=$5

ENDPOINT="http://${SERVER}:${PORT}/api/v1/clusters/${CLUSTERNAME}"

CURL=`curl --silent -u ${USERNAME}:${PASSWORD} -X GET ${ENDPOINT}?fields=alerts_summary`
CHCK=`echo $CURL | grep alerts_summary`

if [[ "$CHCK" == "" ]]; then
   CHECK="Failed"
else
   CHECK="OK"
   CRITICAL=`echo $CURL | jshon -e alerts_summary -e CRITICAL`
   MAINTENANCE=`echo $CURL | jshon -e alerts_summary -e MAINTENANCE`
   OK=`echo $CURL | jshon -e alerts_summary -e OK`
   UNKNOWN=`echo $CURL | jshon -e alerts_summary -e UNKNOWN`
   WARNING=`echo $CURL | jshon -e alerts_summary -e WARNING`
   if [[ "$CRITICAL" > 0 ]];then
     CHECK="Critical"
   elif [[ "$WARNING" > 0 ]];then
     CHECK="Warning"
   fi
fi

if [[ "$CHECK" == "OK" ]]; then
   echo "INFO: Ambari Services - CRITICAL=$CRITICAL, WARNING=$WARNING, OK=$OK, UNKNOWN=$UNKNOWN, MAINTENANCE=$MAINTENANCE"
   exit 0
elif [[ "$CHECK" == "Warning" ]]; then
   echo "WARNING: Ambari Services - CRITICAL=$CRITICAL, WARNING=$WARNING, OK=$OK, UNKNOWN=$UNKNOWN, MAINTENANCE=$MAINTENANCE"
   exit 1
elif [[ "$CHECK" == "Critical" ]]; then
   echo "CRITICAL: Ambari Services - CRITICAL=$CRITICAL, WARNING=$WARNING, OK=$OK, UNKNOWN=$UNKNOWN, MAINTENANCE=$MAINTENANCE"
   exit 2
elif [[ "$CHECK" == "Failed" ]]; then
   echo "CRITICAL: ${SERVER}"
   exit 2
else
   echo "Check failed"
   exit 3
fi
We copy this shell script to the usual directory of Nagios/Icinga
plugins in my case (/usr/lib/nagios/plugins)
After this, you
have to create the corresponding commands for your Nagios/Icinga server:
/etc/icinga/objects/ambari-commands.cfg
define command {
        command_name    check_ambari_alerts_summary
        command_line    /usr/lib/nagios/plugins/check_ambari_alerts_summary.sh '$ARG1$' '$ARG2$' '$ARG3$' '$ARG4$' '$ARG5$'
}
And define the host and service in:
In /etc/icinga/objects/hosts.cfg
define host{
        host_name                       ambari
        alias                           ambari
        address                         ambari.planetexpress.net
        use                             generic-host
}
In /etc/icinga/objects/services_icinga.cfg
define service { use generic-service host_name ambari service_description Ambari Alerts max_check_attempts 3 normal_check_interval 10 retry_check_interval 3 check_command check_ambari_alerts_summary!$HOSTADDRESS$!8080!admin!robot1729!bender }And finally, restarting Nagios/Icinga service
$ sudo service icinga restart
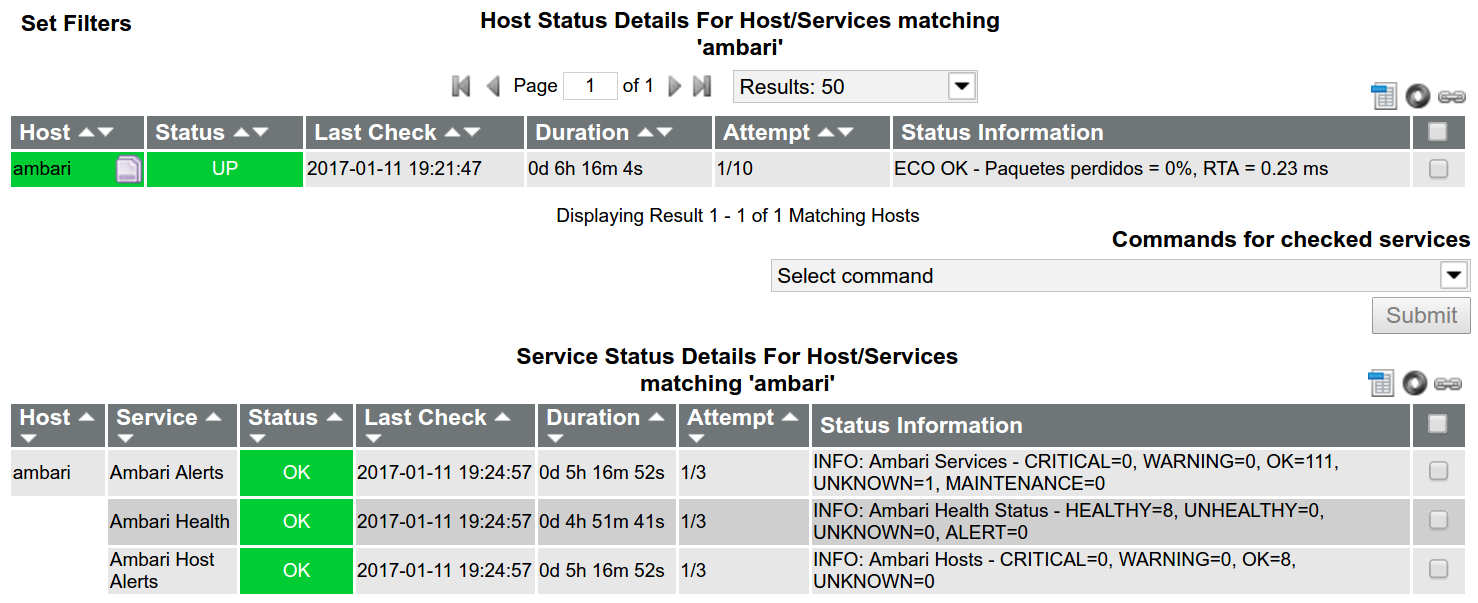
And voilá….

Then you can make similar shell scripts commands with Ambari REST API
as shown in the figure for Ambari Health or Host Alerts. You may also
improve script, validating hostname, curl requests etc etc….
HINT: You need jshon installed in your icinga server
$ sudo apt-get install jshon


