Safer and healthier work at any age
After a year of work for EU-OSHA
Agency (European Agency for Safety & Health at Work), Zylk’s
BI team Iñigo Sanchez, Sergio Argerey and Irune Prado, together with
Bilbomatica’s team, has concluded a huge and ambitious project where
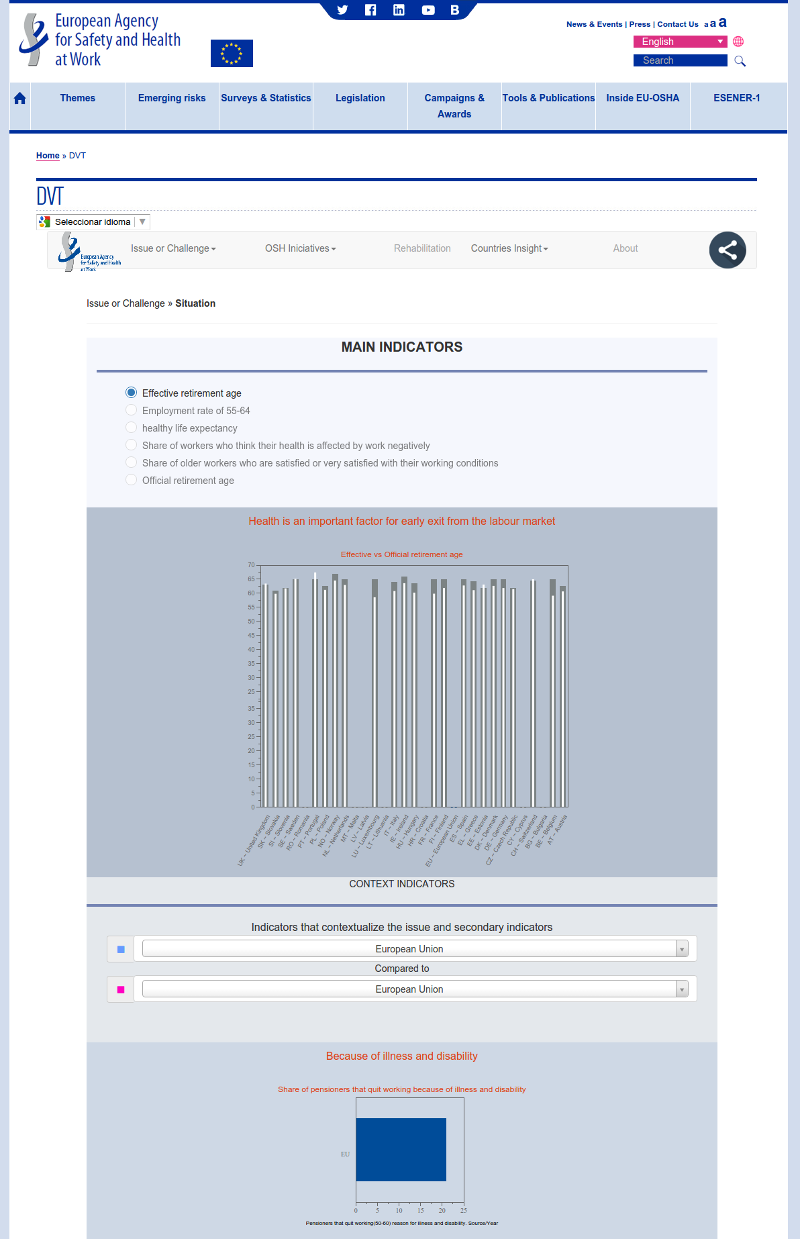
dashboards are delivered as dynamic infographics, using Pentaho
Community Dashboard Framework. The result is available in the following link
Phase 0 – Selection of the tool
This project was born in order to satisfy Agency’s requirements of
having a mixture of quantitative and qualitative data, where a
report’s result is made live, for general public, in order to present
its conclusions.
Some of the requirements were the following:
- User-friendliness, being compatible with most recent browsers and devices.
- Ability to manage a mixed-up composition of both quantitative and
qualitative data- For qualitative data, features such as internationalization
(i18n), localization (l10n), searching facilities, simplicity
of maintenance and theming capabilities were highlighted. - In terms of quantitative data, possibility of transformation,
diverse source origin management and format customization.
- For qualitative data, features such as internationalization
- Availability of a wide graphics catalog, being able to configure
them at the deepest detail, including event handling. - Exporting and sharing capabilities
- Embedding options, being able to manage incoming and outcoming events.
- To be built as a framework, in order to re-use it in future dashboards
- SEO friendliness and traceability within Piwik tools
- Other features; possibility to pre-configure guided “visual
stories”, role definitions for different target users, … - Costs, maintenance and product share in the market
- And of course, robustness, Maintainability, Scalability and Performance
A total of 24 requirements were defined with different weighing of
importance. Pentaho was analysed, together with Tableau, EIGE
Agency-like ad-hoc
development and a Drupal ad-hoc development.
The conclusion was that Drupal was a good tool to manage qualitative
data, while Pentaho for quantitative data, both of them having bad
score in the other part. Mostly, due to the existence of Pentaho’s
Community Dashboard Framework being promising enough, it was opted as
winner, with very few points of difference.
Phase 1 – Pilot
Because the final goal was quite ambitious and the uncertainty/risk
of not being able to achieve it was high, it was decided to make an
initial pilot, in order to test the features of Pentaho satisfying the
requirements defined during the previous phase.
The following modules were defined and tested during the pilot.

- Core Module – As the glue of architecture that makes the
dashboard possible.
This included the definition of the
technology to be used (Angular, Protovis, Pentaho, CDF/CDE, CDA, … modules). - Data Load Module – Based in Pentaho Data Integration for
the required ETL transformations - Data Access Module – For the retrieval of the data from the
defined database, for both quantitative and qualitative data,
taking into consideration possible translations - Embedding Module – Embed the resulting dashboard inside a
Drupal container emulating Agency’s corporate website. - Graphics and Maps Module
- Exporting Module – both to data-type formats (CSV, XSL, … )
and image types (PNG, SVG, …) - Sharing Module – For any user to be able to share the
section of the dashboard it’s seeing, including it’s state, in
terms of the different filters that may be available. - Tracking Module– with Piwik, as par of the Agency’s product stack.
No efforts were performed in terms of design, just the required
developments for the client to visualize the capabilities, and have a
better understatement of the scope and possibilities, within the
defined cost of a pilot.

Phase 2- All-Ages dashboard development
Having both the client and technical team comfortable enough, All
Ages dashboard development started, where final data, graphics design,
and all the little details were taken care of.

Investing in graphics ease of understatement was made imperative,
leading to configurations such as fluidity, color-code, axis
minimum/maximum and step definition.
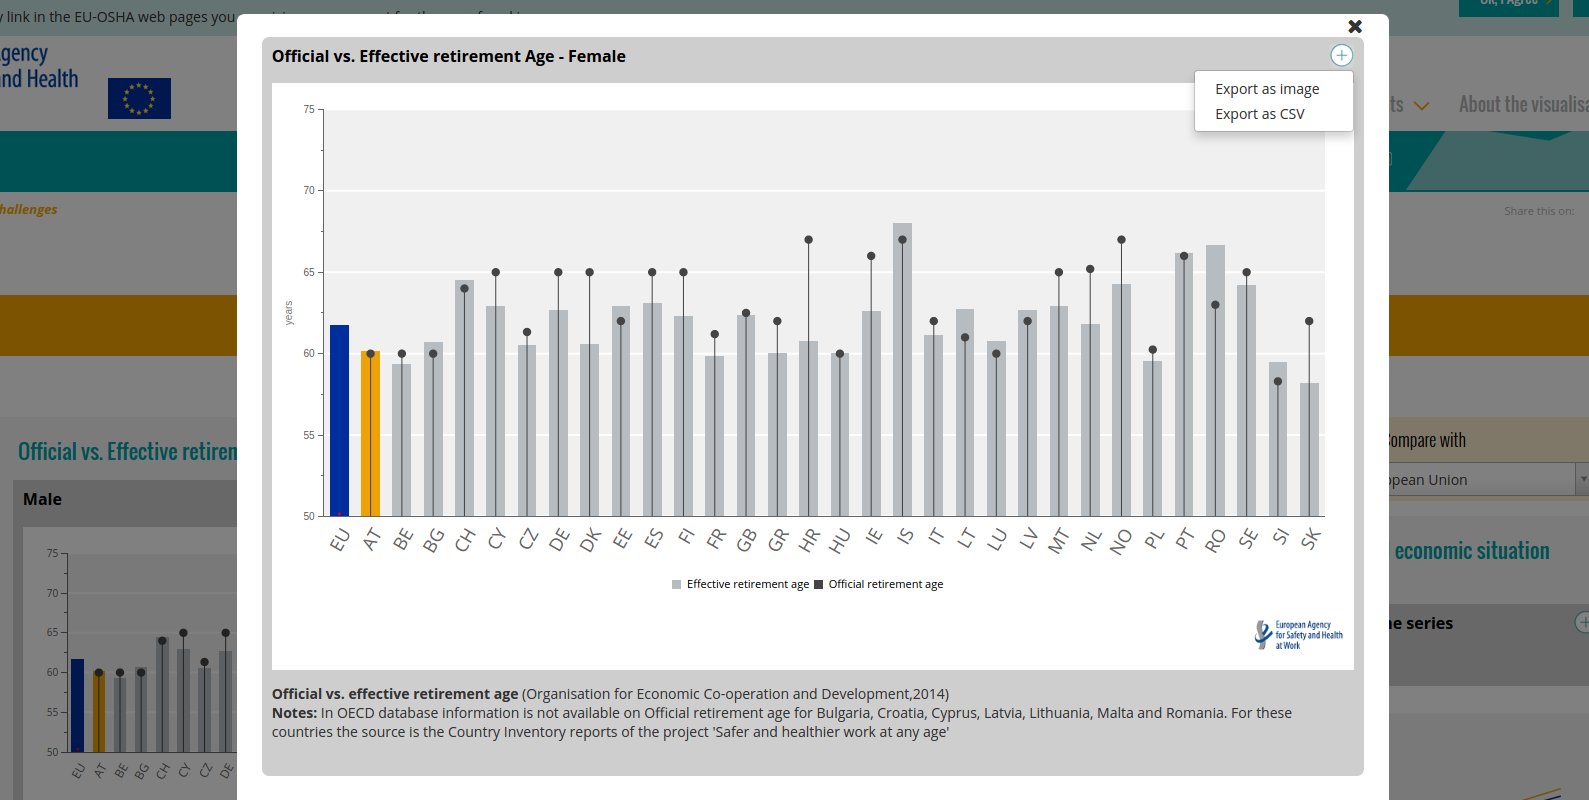
Pampering developments were
performed, such as maximization options, where graphics functional and
technical legend are presented.

Although Pentaho’s CDF’s graphics catalog is quite big, provided by
Protovis library
(from the author of D3) , the used graphics were reduced to the
simplest, only requiring a few atypical ones, such as pyramid,
combined type graphs, and radials.


In terms of qualitative data work, translation efforts were discarded
for this iteration, in favor of using Google Translator, due to its
results being decent enough.
Although new qualitative data uploads were made quick, it was
evidenced that some edition facilities could come handy to the agency,
giving them some level of autonomy.
Conclusions
We’ve learned A LOT from Pentaho’s Framework in terms of CDF usage,
Protovis graphics and Javascript, and a huge list of good-practices
and wishes are currently in our backlog for next developments (thx Taiga.IO and Bunt Planet for making our work easier).
Will let you explore it yourself, please feel free to ask anything in
comments, could elaborate a more thorough post based on your inquiries
Show me the code! At EU-OSHA Github (currently in
private repository, hope they will make it public at some time)
Other Similar projects
Other European Agencies efforts in order to bring statistical
information to general public:
- EU-OSHA
- ESENER1 https://osha.europa.eu/en/surveys-and-statistics-osh/esener/2009
- ESENER2 https://osha.europa.eu/en/surveys-and-statistics-osh/esener/2014
- EIGE (European Institute for Gender Equality)
- Gender Equality Index http://eige.europa.eu/gender-statistics/gender-equality-index
- Gender Statistics Database http://eige.europa.eu/gender-statistics/dgs
- Eurofound
- European Working Condition Surveys http://www.eurofound.europa.eu/surveys/data-visualisation
FRA (Fundamental Rights Agency) survey data explorer http://fra.europa.eu/en/publications-and-resources/data-and-maps/survey-data-explorers
- European Working Condition Surveys http://www.eurofound.europa.eu/surveys/data-visualisation
- FAO (Food and Agriculture Organization of the United Nations)
- FAOSTAT (beta) http://faostat.fao.org/beta/en/#country/203
- CEDEFOP (European Centre for the Development of Vocational Training)
- Skills Panorama http://skillspanorama.cedefop.europa.eu/en
- Institute of Health Metrics and Evaluation


