Alfresco logs in Kibana
Some days ago I wrote a post about how to set up a basic Kibana dashboard in Alfresco Enterprise with JMX metrics, from a logstash JMX input. Today I’m gonna add some simple configuration for creating a dashboard for Alfresco logs. The architecture for ELK is the same of the previous post, with logstash running in your Alfresco instance and a dedicated Elastic Search and Kibana server. In this case the logstash.conf configuration would be something like this:
##
## Tomcat catalina.out logs
##
input {
  file {
    type => "alfresco-log"
    path => ["/opt/alfresco/tomcat/logs/catalina.out", "/opt/alfresco/tomcat/logs/catalina*out*"]
  }
}

##
## Filters for alfresco-log
##
filter {
  if [type] == "alfresco-log" {
    # replace double blank space with single blank space
    mutate {
      gsub => [
        "message", "  ", " "
      ]
    }

    # Match incoming log entries to fields logLevel, class and Msg
    grok {
      match => [ "message", "%{TIMESTAMP_ISO8601:logdate}s*%{LOGLEVEL:logLevel} %{NOTSPACE:class}s*%{GREEDYDATA:Msg}" ]
    }

    # Match logdate from timestamp
    date {
       match => ["logdate" , "yyyy-MM-dd HH:mm:ss,SSS"]
       target => "@timestamp"
    }
  }
}

##
## Output to Elasticsearch
##
output {
  #Uncomment for debugging purposes
  #stdout { codec => rubydebug }
  elasticsearch {
    hosts => ["elasticserver:9200"]
  }

}
It is clear that this is a simple grok parser, for a standard log entry in catalina.out. It’s just a starting point, and you can improve it so much, for parsing messages for example. Also, you may add other log files in Alfresco (such as localhost access logs, alfresco.log, share.log or solr.log).
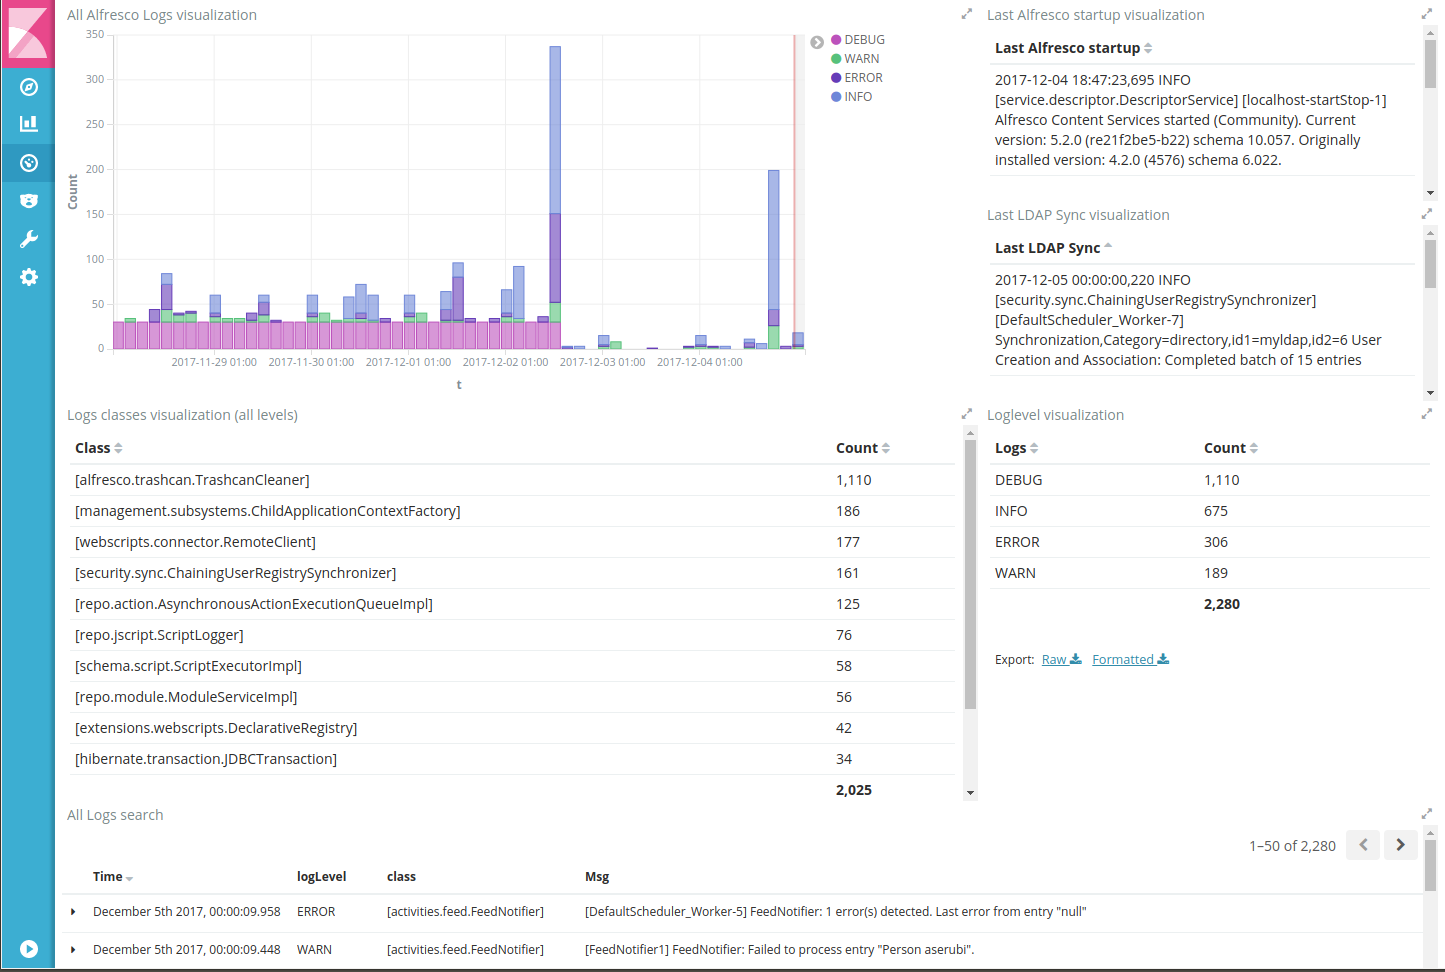
Once Elastic Server has the corresponding indices (including full message, timestamp, loglevel and class), we can build a simple dashboard for catalina logs as the following:

For illustrating this, we generated more logging than usual, activating DEBUG in thrashcan cleaner and ldap syncs for example. We may observe the extra log entries in the graph for these classes. Also the big log peaks are relating to Alfresco startups. The dashboard allows to create building blocks with helper custom searches (as last ldap sync or last startup), tables (for counting and filtering log level and class) and visualizations (number of logs in a time interval). From here, we can analize logs easier visualizing and filtering by log level and class directly, in a given time interval. This is tested with ELK 5.6.3 in Alfresco Community 201707GA as noted in Alfresco logs.
Additional Alfresco ELK resources:
- https://www.zylk.net/es/web-2-0/blog/-/blogs/kibana-dashboard-for-monitoring-alfresco-jmx-metrics
- https://github.com/miguel-rodriguez/Docker-ELK-Alfresco-Monitoring

-1024x337.jpg)


