Alfresco Observability with Elastic APM
Last days I played with Elastic APM for gaining some insights on the performance of our Alfresco production instance. The setup is quite straight-foward, although obviously, you need some infraestructure for it:
- An Elastic Search cluster (with Kibana).
- An Elastic APM Server (listening on port 8200, and binded with your Elastic Search cluster).
- An Elastic APM agent jar for the application to monitor (in this case Alfresco).
For setting the Elastic APM Server, we just download the tar.gz version, unpack it and run the following commands. Be sure that APM server configuration (apm-server.yml) is pointing to the Elastic Search output.
$ ./apm-server setup -e
$ ./apm-server -c apm-server.yml -e
In your Alfresco instance, you need to point to Elastic APM client jar in JAVA_OPTS / CATALINA_OPTS and restart Alfresco service. So in your Tomcat’s setenv.sh, you should have something like this:
export CATALINA_OPTS=»$CATALINA_OPTS -javaagent:/opt/elk/packages/elastic-apm-agent-1.12.0.jar»
export CATALINA_OPTS=»$CATALINA_OPTS -Delastic.apm.service_name=alf5″
export CATALINA_OPTS=»$CATALINA_OPTS -Delastic.apm.environment=pro»
export CATALINA_OPTS=»$CATALINA_OPTS -Delastic.apm.server_urls=http://melmac.zylk.net:8200″
In the previous config, you can see the Elastic APM agent jar in /opt/elk/packages/elastic-apm-agent-1.12.0.jar in Alfresco server. This configuration is valid for a Tomcat based service.
And that’s all, pretty simple. Your APM section in Kibana should start to obtain information about transactions, errors and metrics. And with the APM related indices generated in Elastic Search, you may discover and query on the created indices, or even to create custom dashboards too.
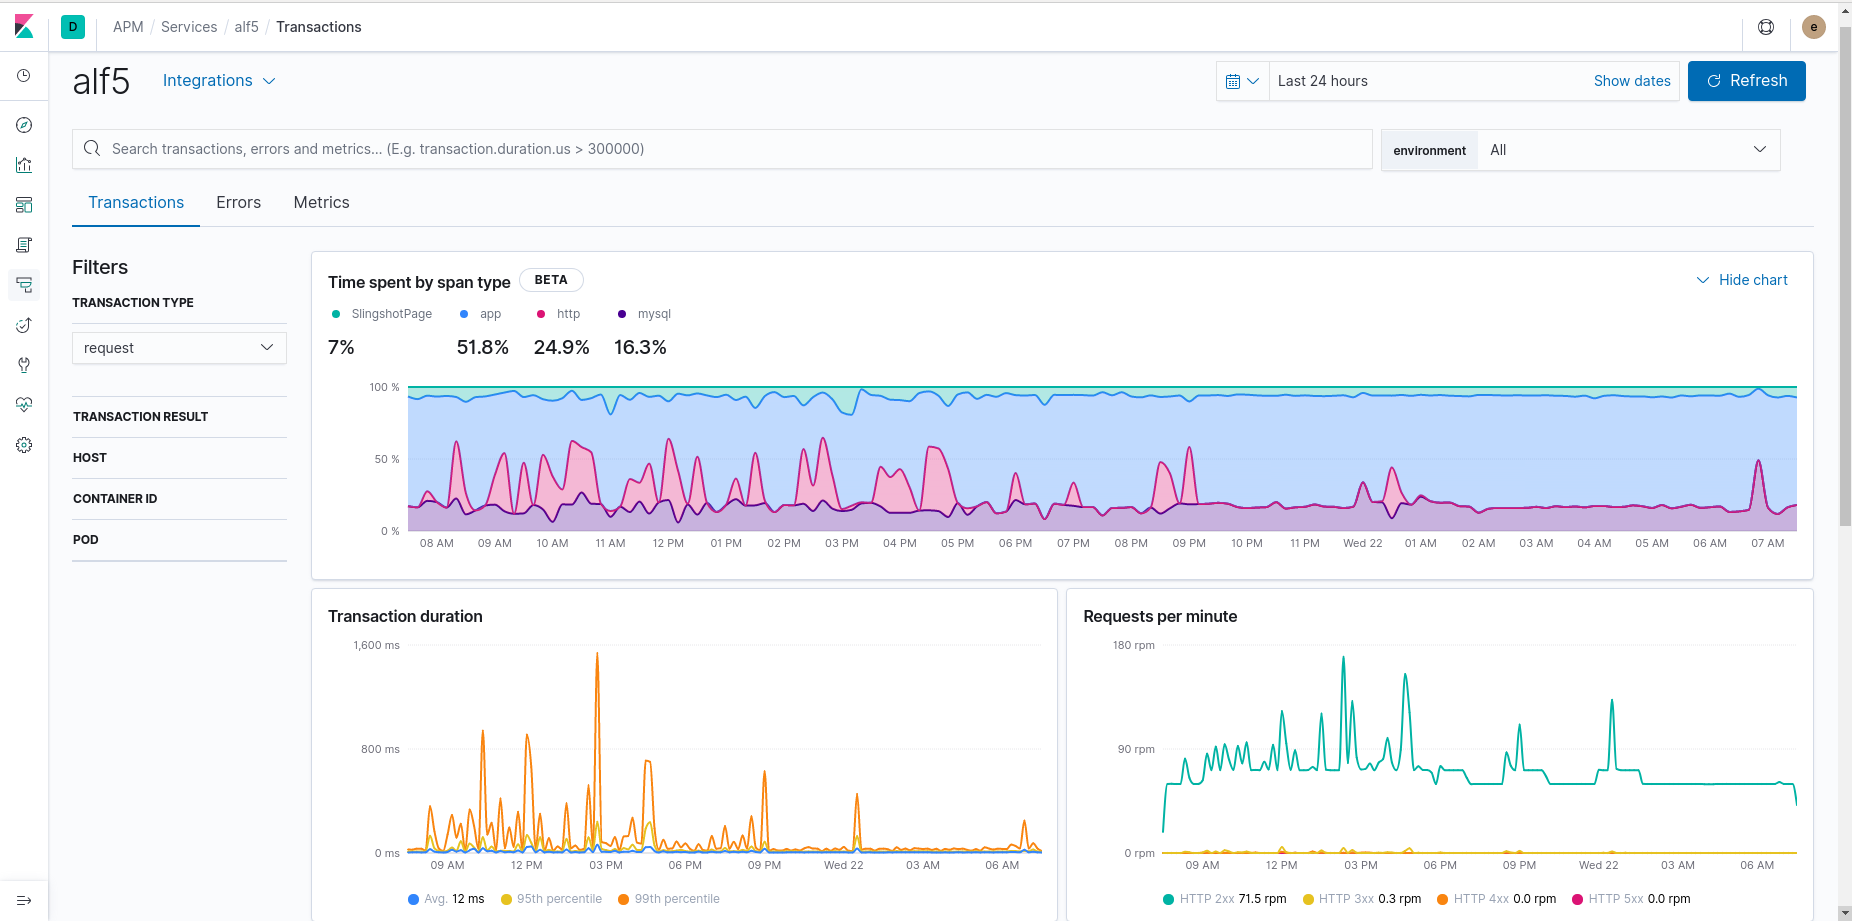
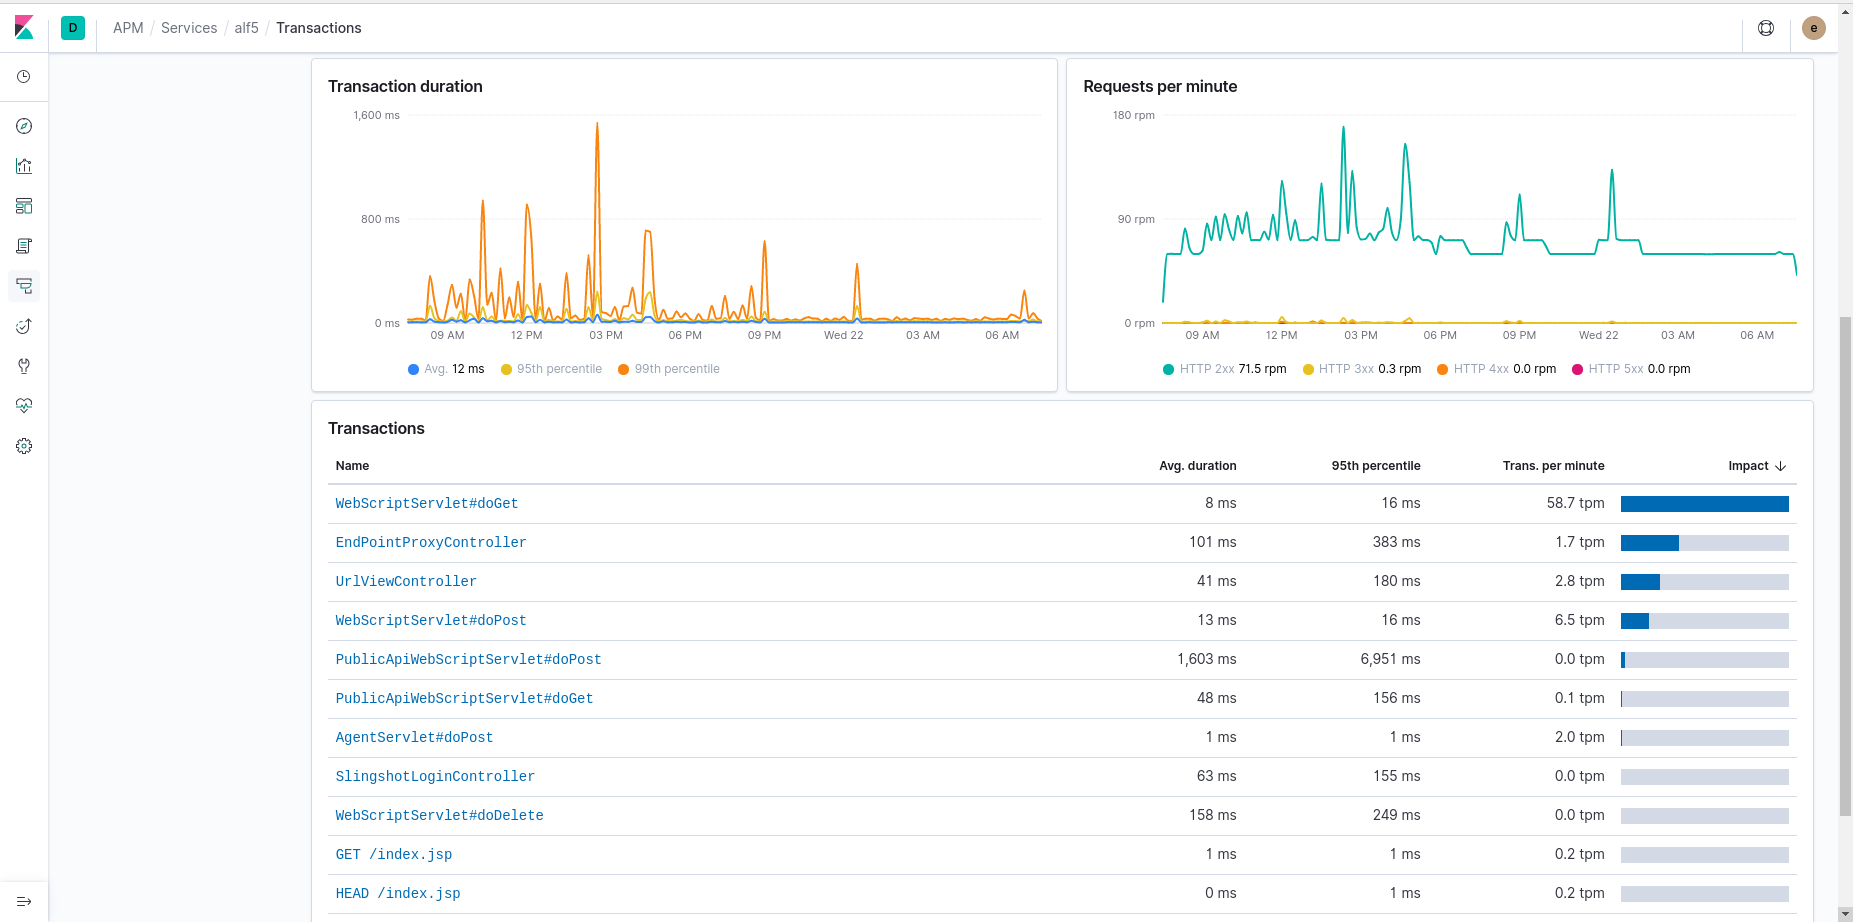
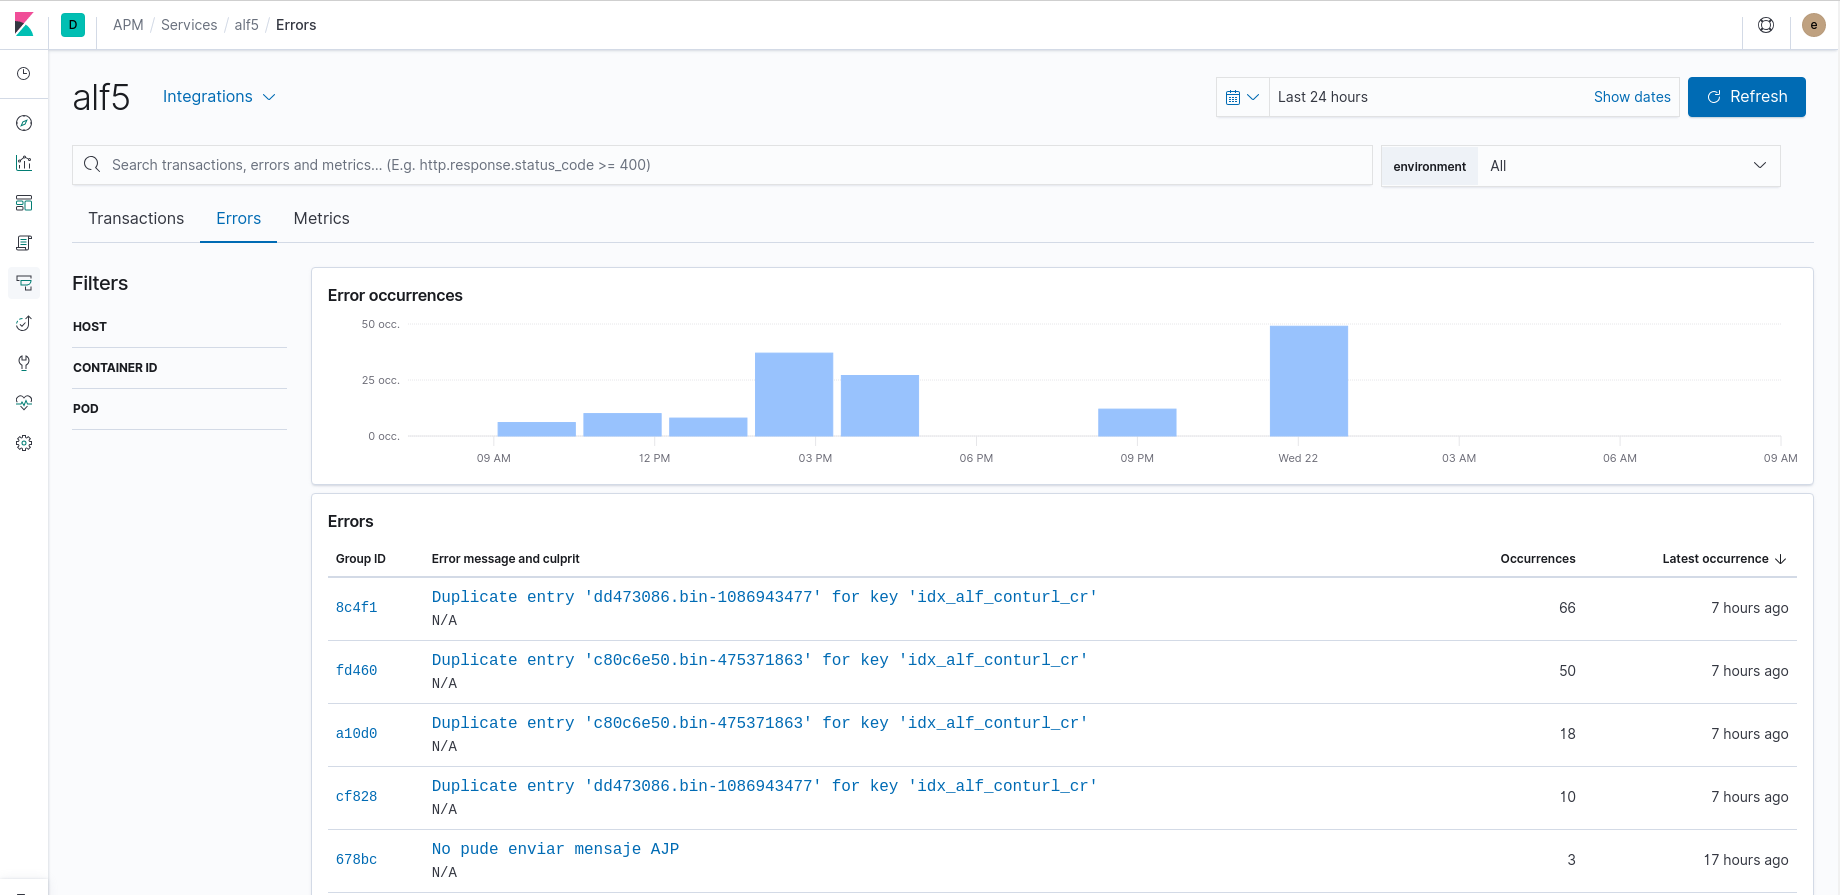
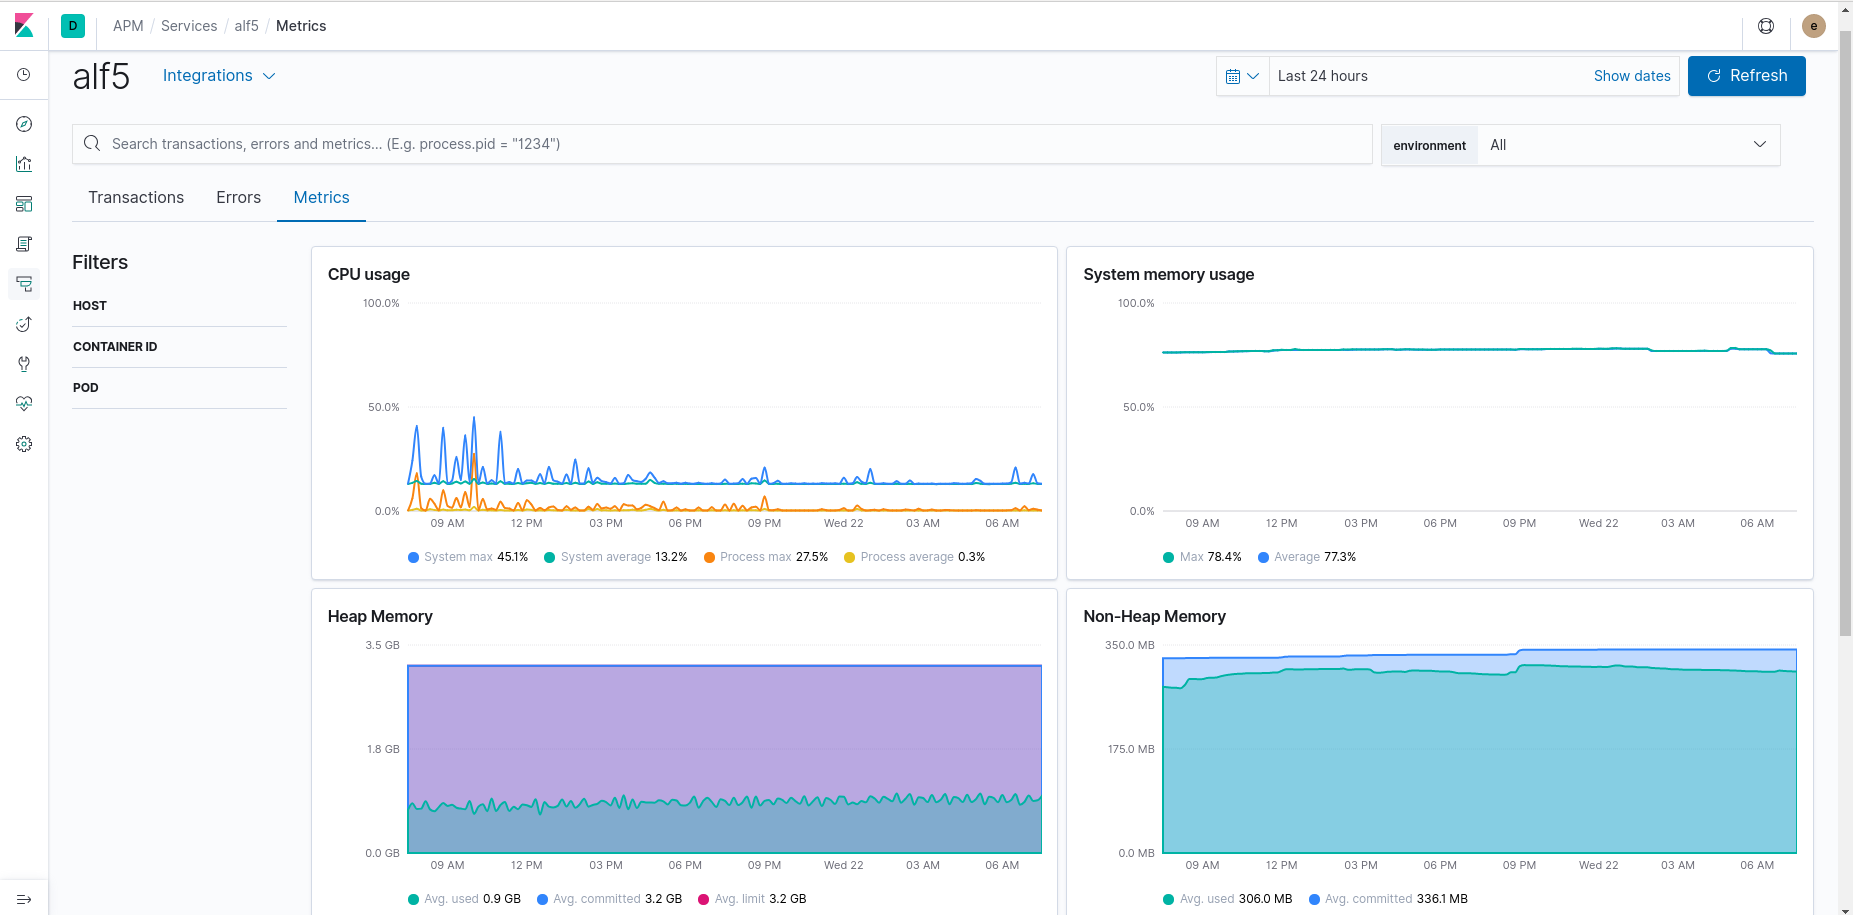
Some screenshots are the following (after some time running):
Transactions: Information about high level transactions, transaction durations and requests per minute, with the possibility to trace the corresponding requests for finding bottlenecks. This may help to answer the eternal question of the forums, why my Alfresco is slow ? Clicking on transactions, you obtain low level information such as Alfresco querys when making calls with Alfresco Java API.


Errors: Another tab provides important information about errors found.

Metrics: The third tab give us some basic metrics of the system (CPU, System Memory, JVM and Threads), which is more or less the information provided from OOTB Support Tools module, but in this console you could manage for example, different Alfresco instances for dev, test and production environments, or different nodes of a cluster.


-1024x190.jpg)


