Enabling monitoring xpack in Elastic Search 7
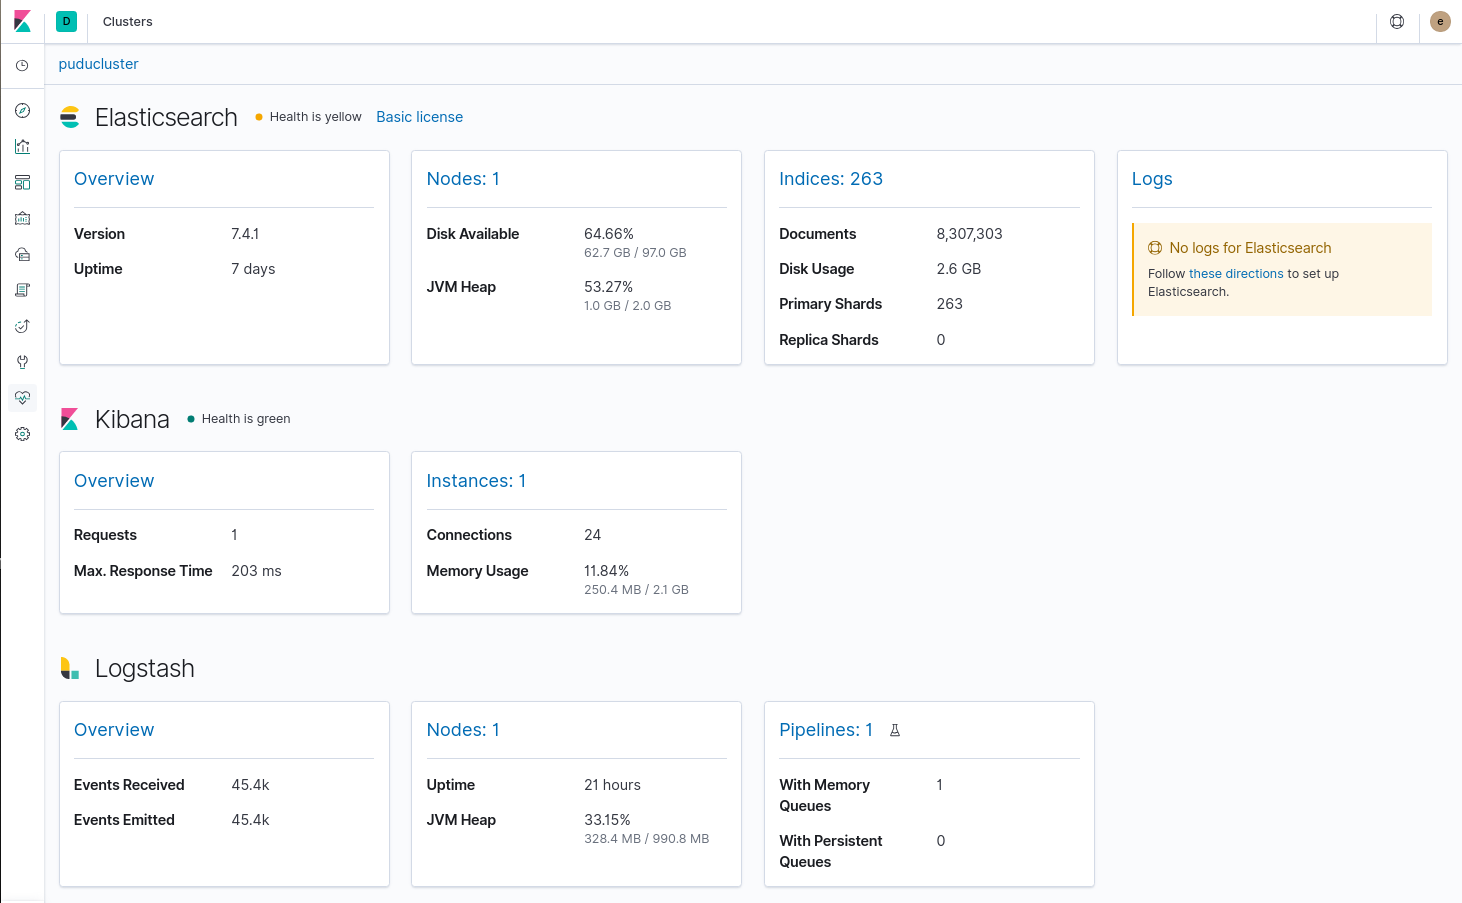
When enabling monitoring xpack in Elastic Search and Logstash, you can enjoy the Stack Monitoring section in Kibana. This section provides a complete interface for monitoring your ELK setup including Elastic Search cluster, Logstash and Kibana.
For enabling (you need to have security xpack enabled first to define the application usersset), and then restart your components with the following config:
In logstash.yml you should set (once authentication is enabled in ES):
# X-Pack Monitoring
# https://www.elastic.co/guide/en/logstash/current/monitoring-logstash.html
xpack.monitoring.enabled: true
xpack.monitoring.elasticsearch.username: logstash_system
xpack.monitoring.elasticsearch.password: secret
xpack.monitoring.elasticsearch.hosts: ["http://localhost:9200"]
In kibana.yml
xpack.monitoring.enabled: true
xpack.monitoring.kibana.collection.enabled: true
In elasticsearch.yml
xpack.monitoring.enabled: true
xpack.monitoring.collection.enabled: true
Then we can find in the Stack Monitoring section in Kibana a compilation of metrics for Elastic Cluster, Kibana or Logstash.

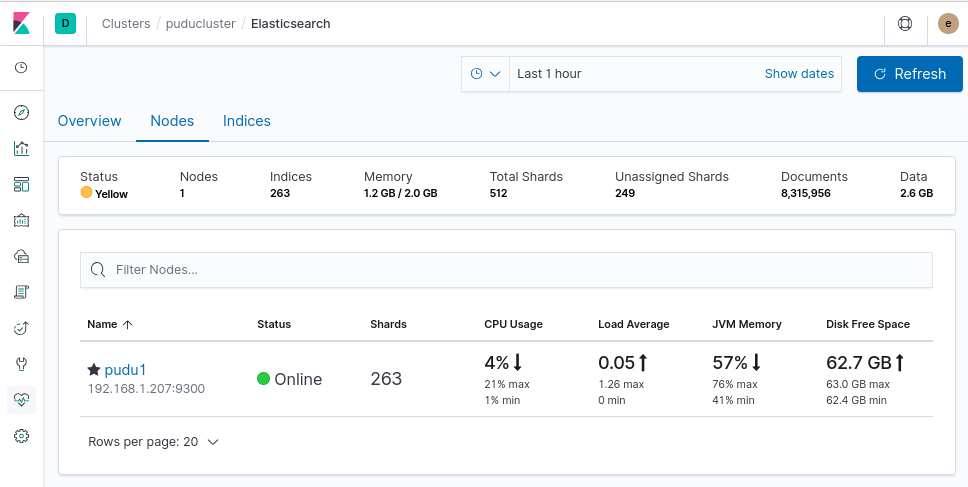
For example, we can inspect the basic metrics of the nodes of the cluster including the number of used indices, shards, unassigned shards, documents and/or data.

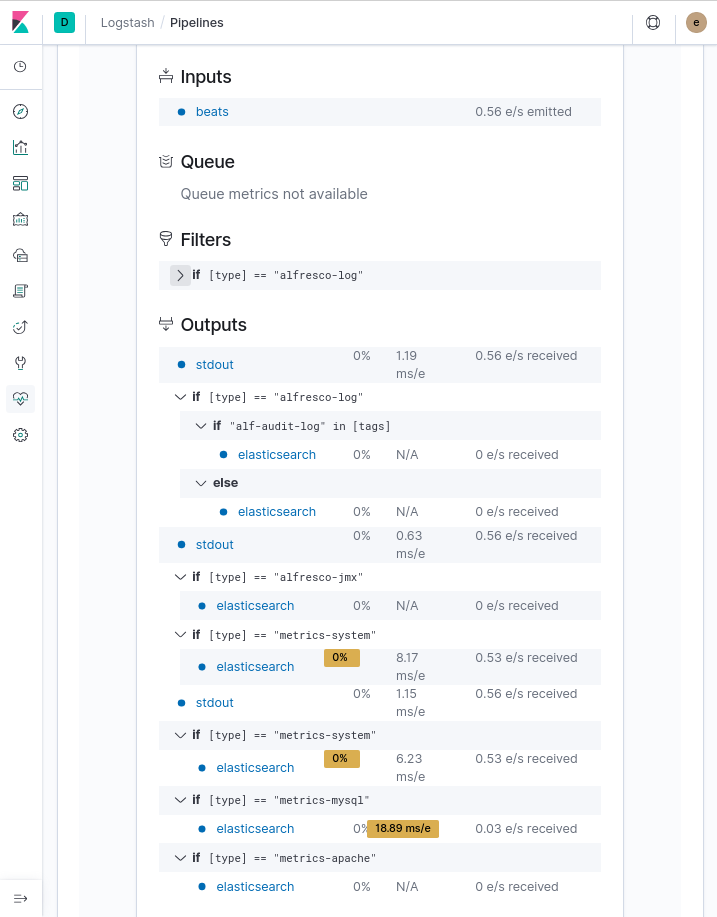
In particular, the logstash monitoring part is very useful because it includes a logstash pipeline viewer which may tell you where are your bottlenecks in your data ingestion processes, how many events are you processing, lattencies and rates. Gold and Silver licenses give pass to pipeline editor for Logstash from Kibana interface.

External Links:

.jpg)


