Monitoring Alfresco CE with ELK stack
Some weeks ago I wrote a post about how to set up a basic Kibana dashboard representing System Performance and Active Sessions in Alfresco Enterprise via JMX metrics from a logstash JMX input. As you probably know, no such Alfresco JMX objects are available in Alfresco Community, such as active sessions (only the java and catalina objects are available). Anyway, it is possible to obtain a similar dashboard using the relevant information from a webscript, for example, the JSON-based webscripts of the OOTB Support Tools addon. Instead of logstash JMX input, we will use the http poller input in logstash. So in logstash.conf
##
## OOTB Admin performance webscript
##
input {
  http_poller {
    id => "ootb-poller-performance"
    type => "ootb-performance"
    urls => {

      alfie_perform => {
         url => "http://localhost:8080/alfresco/service/ootbee/admin/admin-performance.json"
         method => "GET"
         headers => {
          Accept => "application/json"
         }
         auth => {
          user => "monitor"
          password => "s3cret"
         }
      }

    }
    automatic_retries => 0
    #schedule => { cron => "* * * * * UTC"}
    schedule => { every => "60s" }
    request_timeout => 8
    tags => ootb
  }
}

##
## Filters for OOTB
##
## Hint: Convert string metric to numeric value
##
filter {
  if [type] == "ootb-performance" {
    mutate {
      convert => { "MaxMemory" => "float" }
      convert => { "TotalMemory" => "float" }
      convert => { "UsedMemory" => "float" }
      convert => { "FreeMemory" => "float" }
      convert => { "ProcessLoad" => "float" }
      convert => { "SystemLoad" => "float" }
      convert => { "ThreadCount" => "float" }
      convert => { "PeakThreadCount" => "float" }
    }
  }
}
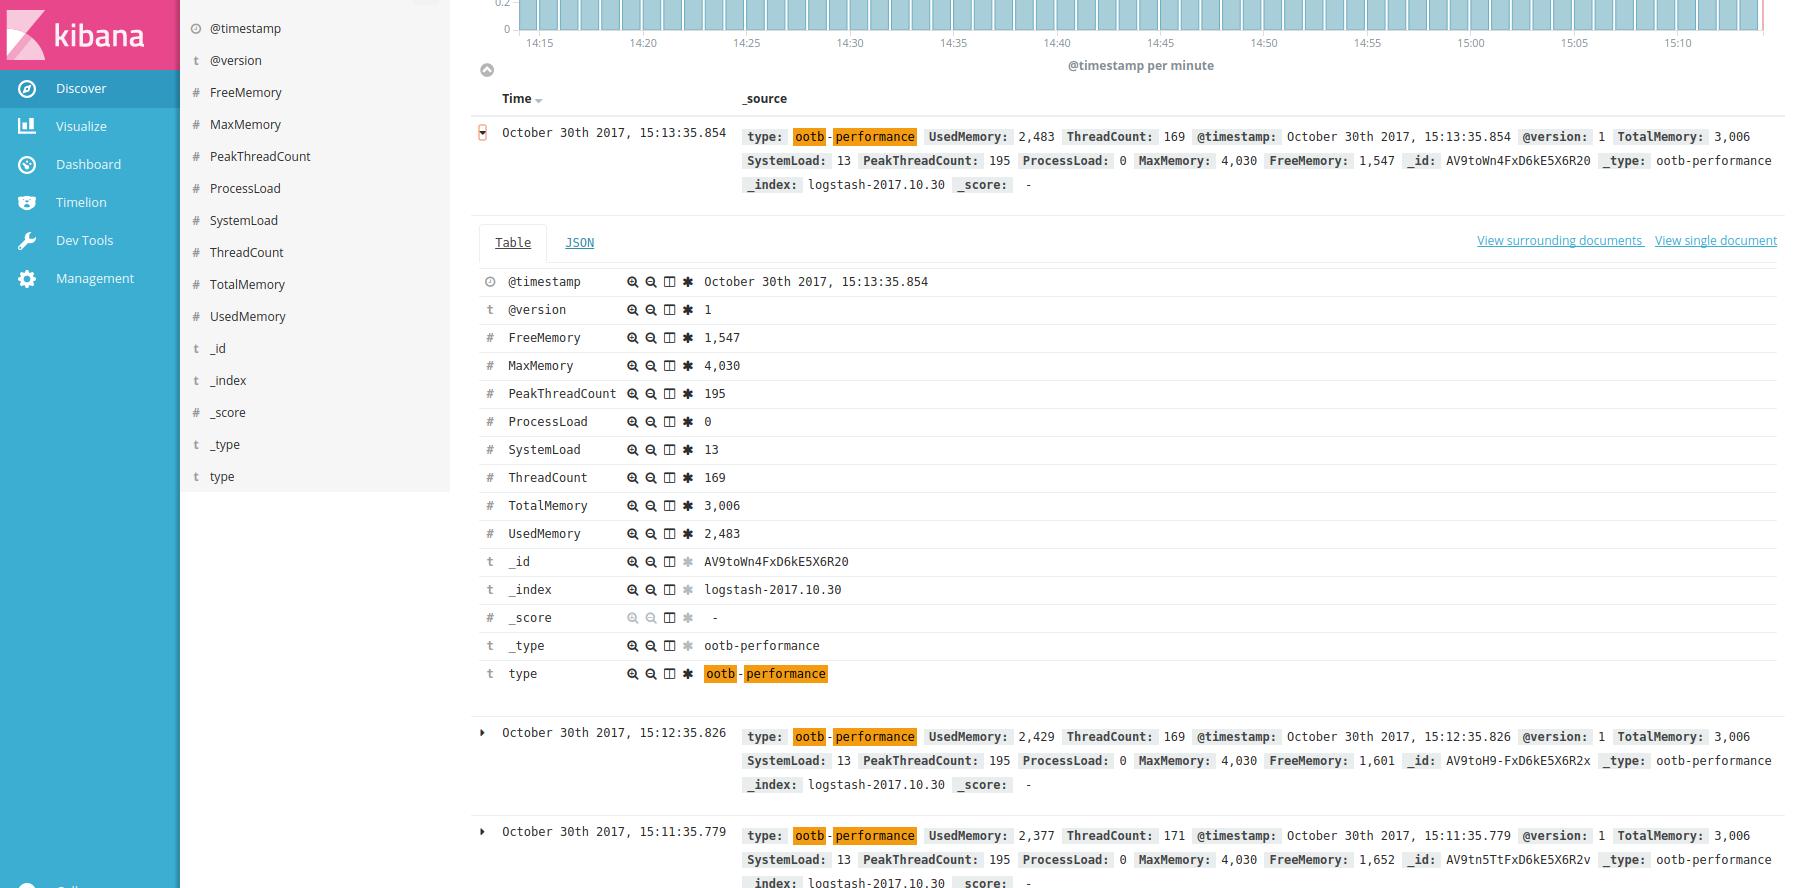
This plugin provides a general json-based http poller for using with Alfresco webscripts, with an Alfresco admin user for monitoring (instead of a JMX read-only user). In this case, all custom fields for system performance are indexed in Elastic Search directly (MaxMemory, TotalMemory, UsedMemory, FreeMemory, ProcessLoad, SystemLoad, ThreadCount and PeakThreadCount), and they are available for Kibana searches, visualizations and dashboards, as shown below:

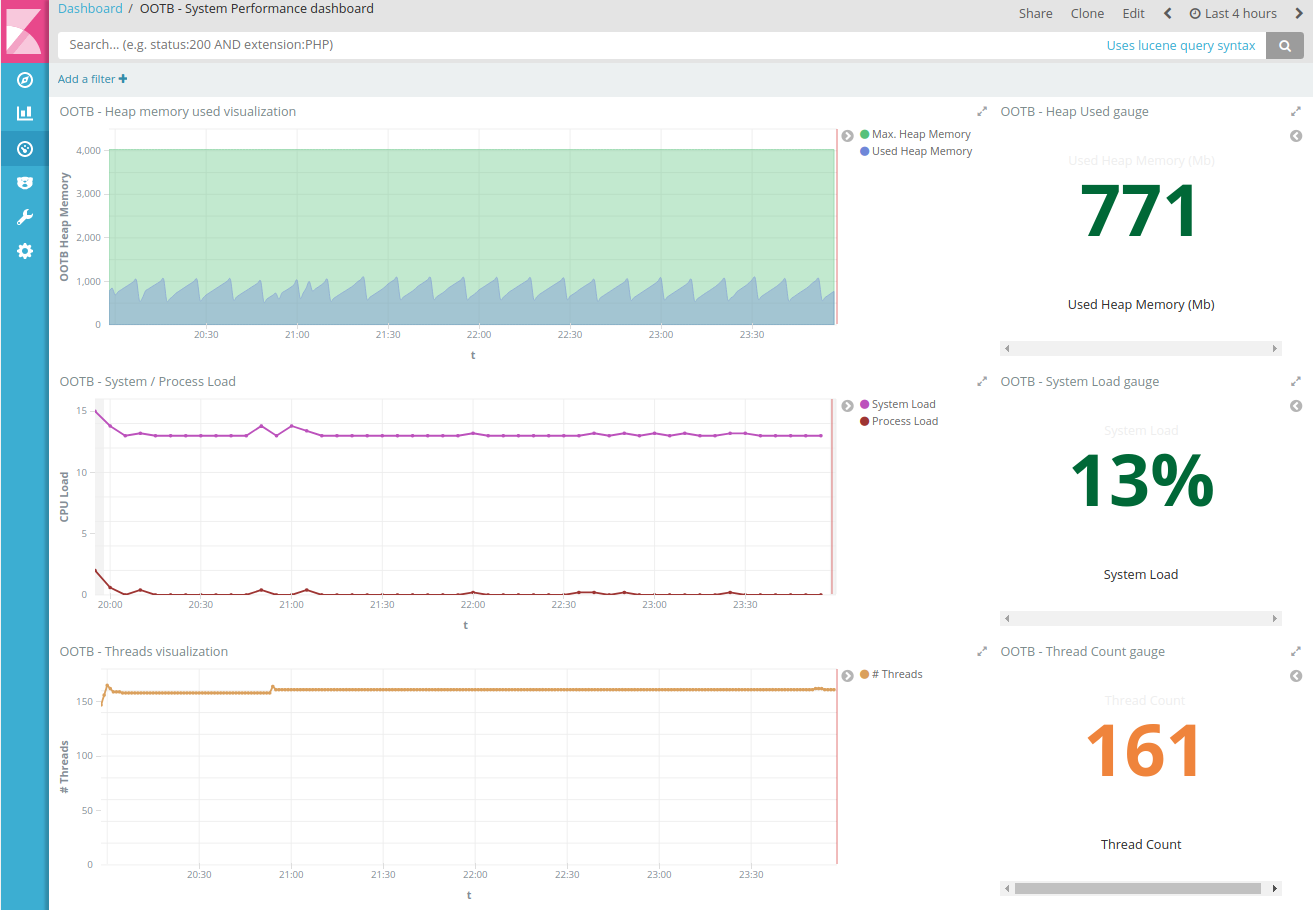
The system performance dashboard in Kibana is more or less like this:

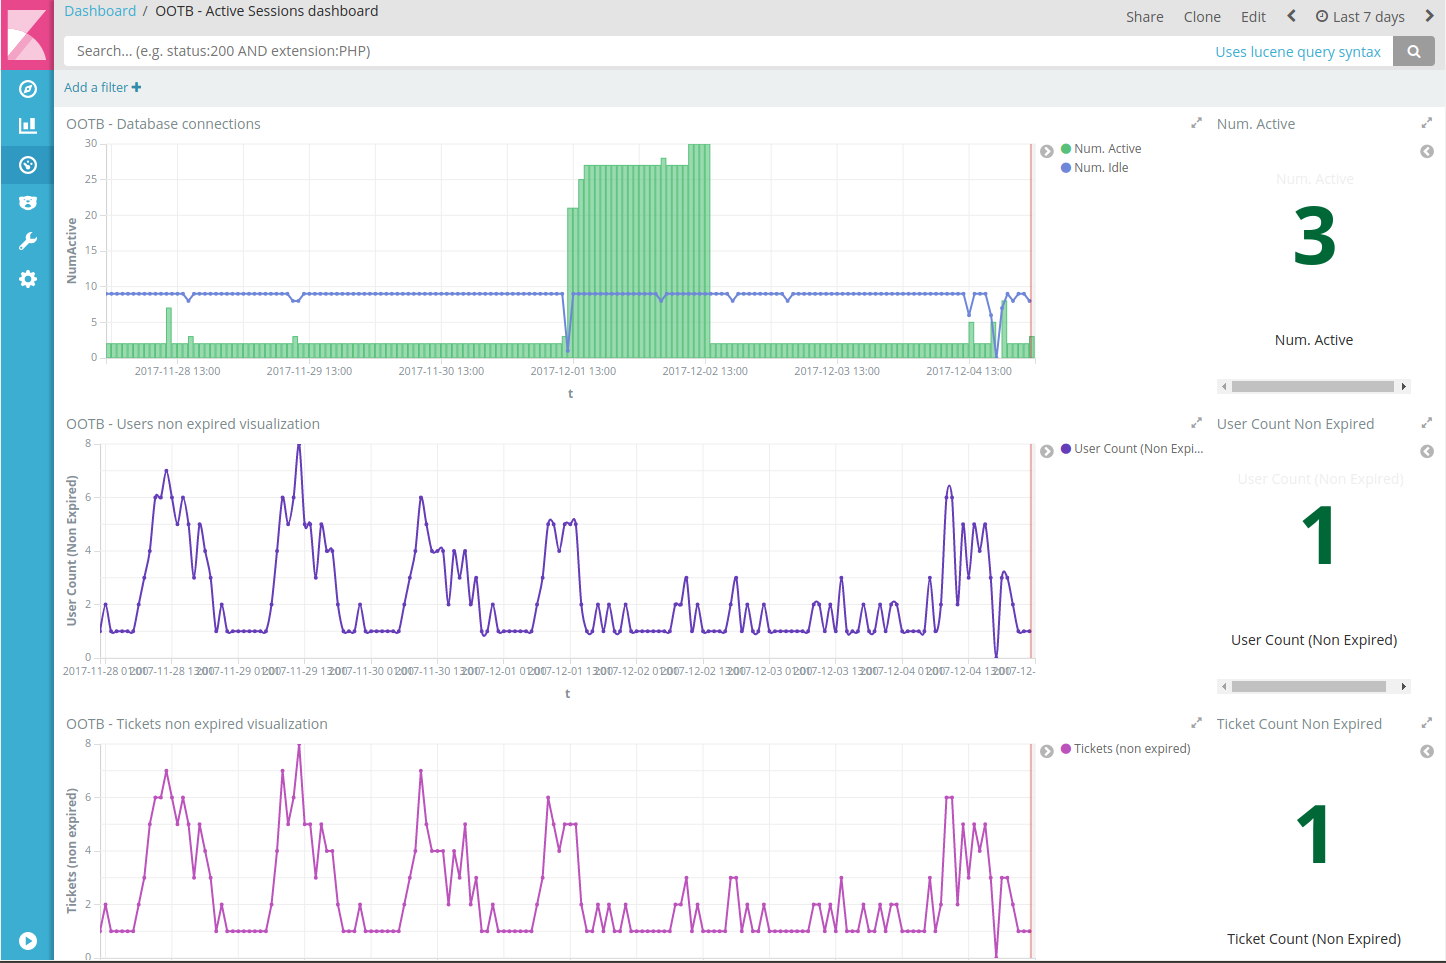
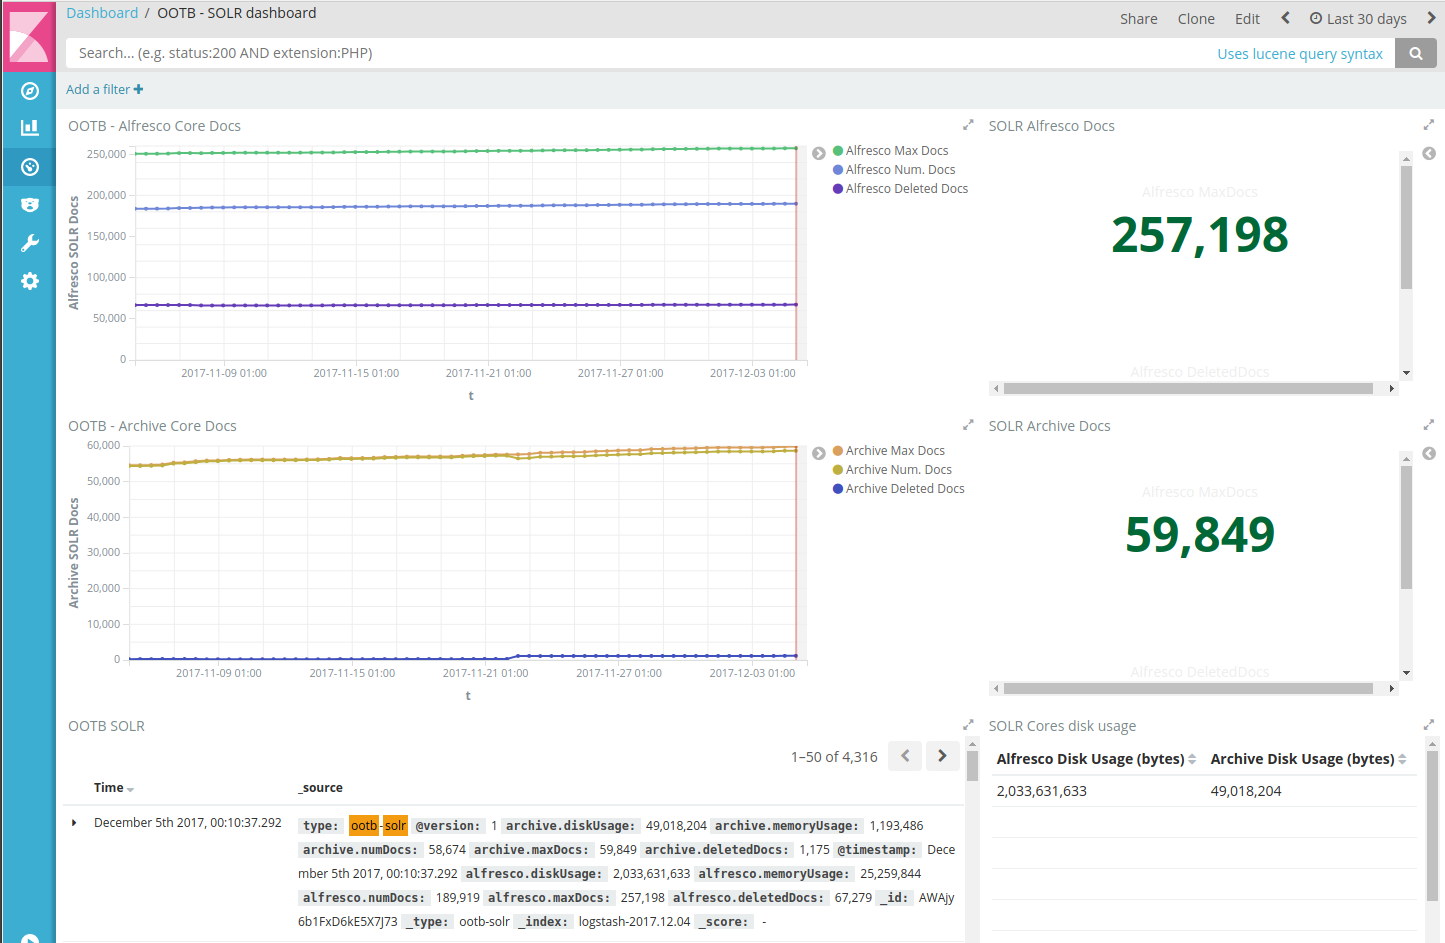
This is extensible to OOTB Active sessions and SOLR webscripts available. For EE users, this is also possible also with the corresponding webscripts of the original Support tools addon.


Links:
- https://www.zylk.net/actualidad/kibana-dashboard-for-monitoring-alfresco-jmx-metrics/
- https://www.elastic.co/guide/en/logstash/current/plugins-inputs-http_poller.html
- https://github.com/OrderOfTheBee/ootbee-support-tools

.jpg)


